
Page 32 - IJAMD-1-3
P. 32
International Journal of AI for
Materials and Design
Prediction of wall geometry for wire arc additive manufacturing
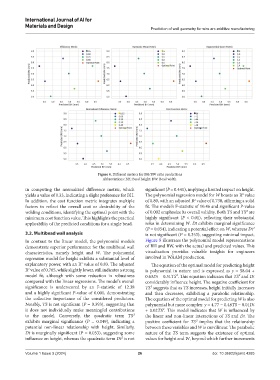
Figure 4. Different metrics for BH/BW ratio predictions
Abbreviations: BH: Bead height; BW: Bead width.
in computing the normalized difference metric, which significant (P = 0.441), implying a limited impact on height.
yields a value of 0.33, indicating a slight preference for BH. The polynomial regression model for W boasts an R value
2
In addition, the cost function metric integrates multiple of 0.80, with an adjusted R value of 0.730, affirming a solid
2
factors to reflect the overall cost or desirability of the fit. The model’s F-statistic of 10.46 and significant P-value
welding conditions, identifying the optimal point with the of 0.002 emphasize its overall validity. Both TS and TS² are
minimum cost function value. This highlights the practical highly significant (P < 0.01), reflecting their substantial
applicability of the predicted conditions for a single bead. roles in determining W. Dt exhibits marginal significance
(P = 0.054), indicating a potential effect on W, whereas Dt²
3.2. Multibead wall analysis is not significant (P = 0.353), suggesting minimal impact.
In contrast to the linear model, the polynomial models Figure 5 illustrates the polynomial model representations
demonstrate superior performance for the multibead wall of BH and BW, with the actual and predicted values. This
characteristics, namely height and W. The polynomial visualization provides valuable insights for engineers
regression model for height exhibits a substantial level of involved in WAAM production.
explanatory power, with an R value of 0.83. The adjusted The equation of the optimal model for predicting height
2
R value of 0.765, while slightly lower, still indicates a strong is polynomial in nature and is expressed as y = 58.04 +
2
model fit, although with some reduction in robustness 0.63Dt − 0.51TS². This equation indicates that TS² and Dt
compared with the linear regressions. The model’s overall considerably influence height. The negative coefficient for
significance is underscored by an F-statistic of 12.38 TS² suggests that as TS increases, height initially increases
and a highly significant P-value of 0.001, demonstrating and then decreases, exhibiting a parabolic relationship.
the collective importance of the considered predictors. The equation of the optimal model for predicting W is also
Notably, TS is not significant (P = 0.393), suggesting that polynomial but more complex: y = 4.77 − 0.48TS − 0.01Dt
it does not individually make meaningful contributions + 0.02TS². This model indicates that W is influenced by
to the model. Conversely, the quadratic term TS² the linear and non-linear interactions of TS and Dt. The
exhibits marginal significance (P = 0.049), indicating a positive coefficient for TS² implies that the relationship
potential non-linear relationship with height. Similarly, between these variables and W is curvilinear. The parabolic
Dt is marginally significant (P = 0.053), suggesting some nature of the TS term suggests the existence of optimal
influence on height, whereas the quadratic term Dt² is not values for height and W, beyond which further increments
Volume 1 Issue 3 (2024) 26 doi: 10.36922/ijamd.4285