
Page 31 - IJAMD-1-3
P. 31
International Journal of AI for
Materials and Design
Prediction of wall geometry for wire arc additive manufacturing
TS, including their interaction. Further supporting this straightforward adjustments to V and TS to achieve the
linear model, the ANOVA results for BH indicated that desired height. Similarly, the best-fit model for BW is also
neither V nor TS alone was statistically significant at the linear and is expressed as y = −7.55 + 0.66V – 0.13TS.
0.05 level, with P-values of 0.046 and 0.005, respectively. This equation demonstrates that V and TS affect BW. The
The interaction between V and TS also lacked statistical simplicity and statistical significance of this model indicate
significance (P-value = 0.106). These results imply that that these factors are critical in determining BH and BW,
the additive linear effects of V and TS are sufficient for and their effects are effectively captured by the linear terms
modeling BH, highlighting the robustness of the linear without requiring higher-order polynomial terms.
regression model for this response variable.
Evaluating the optimization of the welding process
For BW, similar to BH, the linear model yielded an using various metrics offers detailed insights into the
MSE of 0.061 and an R² value of 0.88, indicating that the optimal welding conditions. The full factorial design
linear model explained approximately 88% of the variance predicts BH and BW values across different combinations
in BW. This suggests a strong linear dependency of V and of V and TS. For instance, when V = 22 and TS = 5, the
TS. The ANOVA results for BW revealed that V and TS are predicted BH is 6.67 mm, whereas the predicted BW is
significant factors (P-value = 0.004 and 0.002, respectively). 6.35 mm. Hence, by adjusting the values of V and TS, a
This highlights the predominant influence of V on BW specific ratio can be targeted. Several metrics are employed
and suggests that a simple linear model is sufficient for to assess these predictions, including efficiency, harmonic
capturing the relationship between the input parameters mean, exponential score, normalized difference, and
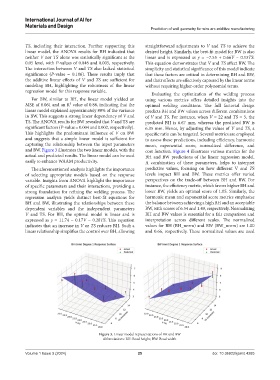
and BW. Figure 3 illustrates the two linear models, with the cost function. Figure 4 illustrates various metrics for the
actual and predicted results. The linear model can be used BH and BW predictions of the linear regression model.
easily to enhance WAAM productivity. A combination of these parameters, helps to interpret
The aforementioned analysis highlights the importance predictive values, focusing on how different V and TS
of selecting appropriate models based on the response levels impact BH and BW. These metrics offer varied
variable. Insights from ANOVA highlight the importance perspectives on the trade-off between BH and BW. For
of specific parameters and their interactions, providing a instance, the efficiency metric, which favors higher BH and
strong foundation for refining the welding process. The lower BW, yields an optimal score of 1.05. Similarly, the
regression analysis yields distinct best-fit equations for harmonic mean and exponential score metrics emphasize
BH and BW, illustrating the relationships between these the balance between achieving a high BH and an acceptable
dependent variables and the independent parameters BW, with scores of 6.54 and 1.49, respectively. Normalizing
V and TS. For BH, the optimal model is linear and is BH and BW values is essential for a fair comparison and
expressed as y = 11.74 − 0.17V − 0.28TS. This equation interpretation across different scales. The normalized
indicates that an increase in V or TS reduces BH. Such a values for BH (BH_norm) and BW (BW_norm) are 1.00
linear relationship simplifies the control over BH, allowing and 0.66, respectively. These normalized values are used
Figure 3. Linear model representations of BH and BW
Abbreviations: BH: Bead height; BW: Bead width.
Volume 1 Issue 3 (2024) 25 doi: 10.36922/ijamd.4285