
Page 34 - IJAMD-1-3
P. 34
International Journal of AI for
Materials and Design
Prediction of wall geometry for wire arc additive manufacturing
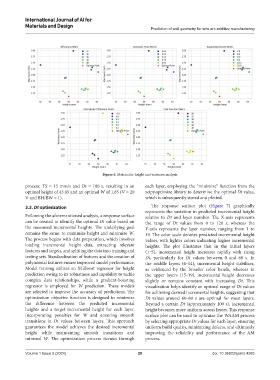
Figure 6. Metrics for height and waviness analysis
process: TS = 15 mm/s and Dt = 100 s, resulting in an each layer, employing the “minimize” function from the
optimal height of 43.85 and an optimal W of 1.85 (V = 20 scipy.optimize library to determine the optimal Dt value,
V and BH/BW = 1). which is subsequently stored and plotted.
3.3. Dt optimization The response surface plot (Figure 7) graphically
represents the variation in predicted incremental height
Following the aforementioned analysis, a response surface relative to Dt and layer number. The X-axis represents
can be created to identify the optimal Dt value based on the range of Dt values from 0 to 120 s, whereas the
the measured incremental heights. The underlying goal Y-axis represents the layer number, ranging from 1 to
remains the same: to maximize height and minimize W. 19. The color scale denotes predicted incremental height
The process begins with data preparation, which involves values, with lighter colors indicating higher incremental
loading incremental height data, extracting relevant heights. The plot illustrates that in the initial layers
features and targets, and splitting the data into training and (1‒5), incremental height increases rapidly with rising
testing sets. Standardization of features and the creation of Dt, particularly for Dt values between 0 and 60 s. In
polynomial features ensure improved model performance. the middle layers (6‒14), incremental height stabilizes,
Model training utilizes an XGBoost regressor for height as evidenced by the broader color bands, whereas in
prediction owing to its robustness and capability to tackle the upper layers (15‒19), incremental height decreases
complex data relationships, while a gradient-boosting slightly or remains constant with increasing Dt. This
regressor is employed for W prediction. These models visualization helps identify an optimal range of Dt values
are selected to improve the accuracy of predictions. The for achieving desired incremental heights, suggesting that
optimization objective function is designed to minimize Dt values around 60‒80 s are optimal for most layers.
the difference between the predicted incremental Beyond a certain Dt (approximately 100 s), incremental
heights and a target incremental height for each layer, height becomes more uniform across layers. This response
incorporating penalties for W and ensuring smooth surface plot can be used to optimize the WAAM process
transitions in Dt values between layers. This approach by selecting appropriate Dt values for each layer, ensuring
guarantees the model achieves the desired incremental uniform build quality, minimizing defects, and ultimately
height while maintaining smooth transitions and improving the reliability and performance of the AM
minimal W. The optimization process iterates through process.
Volume 1 Issue 3 (2024) 28 doi: 10.36922/ijamd.4285