
Page 18 - IJAMD-2-1
P. 18
International Journal of AI for
Materials and Design
Predicting thermal conductivity of sintered Ag
A B
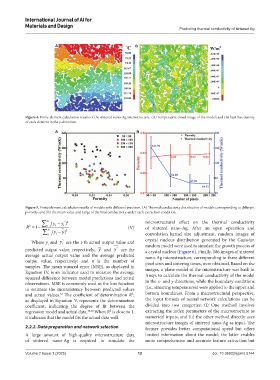
Figure 4. Finite element calculation results of the sintered nano-Ag microstructure. (A) Temperature cloud image of the model; and (B) heat flux density
of each element in the y-direction.
A B
Figure 5. Finite element calculation results of models with different precision. (A) Thermal conductivity distribution of models corresponding to different
porosity; and (B) the mean value and range of thermal conductivity under each extraction condition.
∑ n (y − y *2 microstructural effect on the thermal conductivity
)
R = 1− i= 1 i i (V) of sintered nano-Ag. After an open operation and
2
∑ n i= 1 (y − ) y 2 convolution kernel size adjustment, random images of
i
*
Where y and y are the i-th actual output value and crystal nucleus distribution generated by the Gaussian
i
i
*
predicted output value, respectively; y and y are the random model were used to simulate the growth process of
a crystal nucleus (Figure 6). Finally, 186 images of sintered
average actual output value and the average predicted nano-Ag microstructure, corresponding to three different
output value, respectively; and n is the number of pixel sizes and sintering times, were obtained. Based on the
samples. The mean squared error (MSE), as displayed in images, a plane model of the microstructure was built in
Equation IV, is an indicator used to measure the average Ansys to calculate the thermal conductivity of the model
squared difference between model predictions and actual
observations. MSE is commonly used as the loss function in the x- and y-directions, while the boundary conditions
to estimate the inconsistency between predicted values (i.e., sintering temperatures) were applied to the upper and
and actual values. The coefficient of determination R², bottom boundaries. From a microstructural perspective,
32
as displayed in Equation V, represents the determination the input formats of neural network calculations can be
coefficient, indicating the degree of fit between the divided into two categories: (i) One method involves
regression model and actual data. 33,34 When R² is close to 1, extracting the index parameters of the microstructure as
it indicates that the model fits the actual data well. numerical inputs, and (ii) the other method directly uses
microstructure images of sintered nano-Ag as input. The
2.2.2. Data preparation and network selection former provides better computational speed but offers
A large amount of high-quality microstructure data limited information about the model; the latter enables
of sintered nano-Ag is required to simulate the more comprehensive and accurate feature extraction but
Volume 2 Issue 1 (2025) 12 doi: 10.36922/ijamd.5744