
Page 22 - IJAMD-2-1
P. 22
International Journal of AI for
Materials and Design
Predicting thermal conductivity of sintered Ag
A B
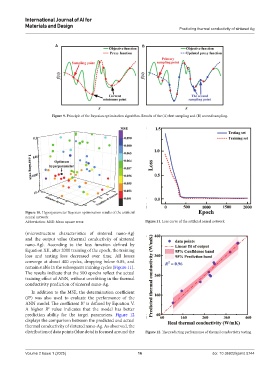
Figure 9. Principle of the Bayesian optimization algorithm. Results of the (A) first sampling and (B) second sampling.
Figure 10. Hyperparameter Bayesian optimization results of the artificial
neural network
Abbreviation: MSE: Mean square error. Figure 11. Loss curve of the artificial neural network
(microstructure characteristics of sintered nano-Ag)
and the output value (thermal conductivity of sintered
nano-Ag). According to the loss function defined by
Equation XII, after 2000 training of the epoch, the training
loss and testing loss decreased over time. All losses
converge at about 400 cycles, dropping below 0.05, and
remain stable in the subsequent training cycles (Figure 11).
The results indicate that the 500 epochs reflect the actual
training effect of ANN, without overfitting in the thermal
conductivity prediction of sintered nano-Ag.
In addition to the MSE, the determination coefficient
(R ) was also used to evaluate the performance of the
2
ANN model. The coefficient R is defined by Equation V.
2
A higher R value indicates that the model has better
2
prediction ability for the target parameters. Figure 12
displays the comparison between the predicted and actual
thermal conductivity of sintered nano-Ag. As observed, the
distribution of data points (blue dots) is focused around the Figure 12. The predicting performance of thermal conductivity testing
Volume 2 Issue 1 (2025) 16 doi: 10.36922/ijamd.5744