
Page 19 - IJAMD-2-1
P. 19
International Journal of AI for
Materials and Design
Predicting thermal conductivity of sintered Ag
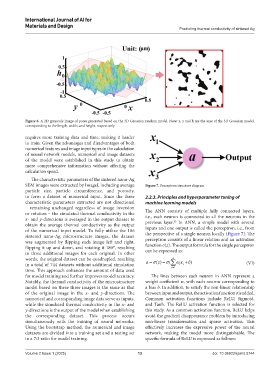
Figure 6. A 2D grayscale image of pores generated based on the 3D Gaussian random model. Note: x, y and h are the axes of the 3D Gaussian model,
corresponding to the length, width, and height, respectively
requires more training data and time, making it harder
to train. Given the advantages and disadvantages of both
numerical features and image input types in the calculation
of neural network models, numerical and image datasets
of the model were established in this study to obtain
more comprehensive information without affecting the
calculation speed.
The characteristic parameters of the sintered nano-Ag
SEM images were extracted by ImageJ, including average Figure 7. Perceptron structure diagram
particle size, particle circumference, and porosity,
to form a dataset of numerical input. Since the three 2.2.3. Principles and hyperparameter tuning of
characteristic parameters extracted are not directional machine learning models
– remaining unchanged regardless of image inversion
or rotation – the simulated thermal conductivity in the The ANN consists of multiple fully connected layers,
x- and y-directions is averaged in the output dataset to i.e., each neuron is connected to all the neurons in the
35
obtain the average thermal conductivity as the output previous layer. In ANN, a simple model with several
of the numerical input model. To fully utilize the 186 inputs and one output is called the perceptron, i.e., from
sintered nano-Ag microstructure images, the dataset the perspective of a single neuron locally (Figure 7). The
was augmented by flipping each image left and right, perceptron consists of a linear relation and an activation
flipping it up and down, and rotating it 180°, resulting function σ(z). The output formula for the single perceptron
in three additional images for each original. In other can be expressed as:
words, the original dataset can be quadrupled, resulting a σ = ()z = σ ( n ω x + ) b
in a total of 744 datasets without additional simulation ∑ 1 i i (VI)
i=
time. This approach enhances the amount of data used
for model training and further improves model accuracy. The lines between each neuron in ANN represent a
Notably, the thermal conductivity of the microstructure weight coefficient w, with each neuron corresponding to
model based on these three images is the same as that a bias b. In addition, to satisfy the non-linear relationship
of the original image in the x- and y-directions. The between input and output, the activation function σ is added.
numerical and corresponding image data serve as inputs, Common activation functions include ReLU, Sigmoid,
while the simulated thermal conductivity in the x- and and Tanh. The ReLU activation function is selected for
y-directions is the output of the model when establishing this study. As a common activation function, ReLU helps
the corresponding dataset. This process occurs avoid the gradient disappearance problem by introducing
simultaneously with the training of neural networks. non-linear transformation and sparse activation. This
Using the bootstrap method, the numerical and image effectively increases the expressive power of the neural
datasets are divided into a training set and a testing set network, making the model more distinguishable. The
in a 7:3 ratio for model training. specific formula of ReLU is expressed as follows:
Volume 2 Issue 1 (2025) 13 doi: 10.36922/ijamd.5744