
Page 53 - IJAMD-2-1
P. 53
International Journal of AI for
Materials and Design
ML-based MPC for multizone BAC
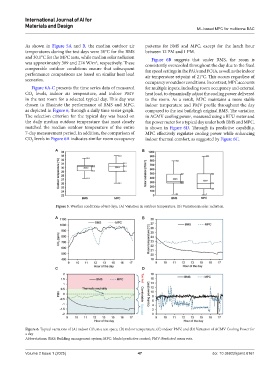
As shown in Figure 5A and B, the median outdoor air patterns for BMS and MPC, except for the lunch hour
temperatures during the test days were 30°C for the BMS between 12 PM and 1 PM.
and 30.1°C for the MPC tests, while median solar radiation Figure 6B suggests that under BMS, the room is
was approximately 309 and 274 W/m , respectively. These consistently overcooled throughout the day due to the fixed
2
comparable outdoor conditions ensure that subsequent fan speed settings in the PAUs and FCUs, as well as the indoor
performance comparisons are based on similar heat load air temperature setpoint of 21°C. This occurs regardless of
scenarios. occupancy or outdoor conditions. In contrast, MPC accounts
Figure 6A-C presents the time series data of measured for multiple inputs, including room occupancy and external
CO levels, indoor air temperature, and indoor PMV heat load, to dynamically adjust the cooling power delivered
2
in the test room for a selected typical day. This day was to the room. As a result, MPC maintains a more stable
chosen to illustrate the performance of BMS and MPC, indoor temperature and PMV profile throughout the day
as depicted in Figure 6, through a daily time series graph. compared to the test building’s original BMS. The variation
The selection criterion for the typical day was based on in ACMV cooling power, measured using a BTU meter and
the daily median outdoor temperature that most closely fan power meter for a typical day under both BMS and MPC,
matched the median outdoor temperature of the entire is shown in Figure 6D. Through its predictive capability,
7-day measurement period. In addition, the comparison of MPC effectively regulates cooling power while enhancing
CO levels in Figure 6A indicates similar room occupancy indoor thermal comfort, as suggested by Figure 6C.
2
A B
Figure 5. Weather conditions of test days. (A) Variation in outdoor temperature, (B) Variation in solar radiation.
A B
C D
Figure 6. Typical variations of (A) indoor CO 2 in a test space, (B) indoor temperature, (C) indoor PMV, and (D) Variation of ACMV Cooling Power for
a day
Abbreviations: BMS: Building management system; MPC: Model predictive control; PMV: Predicted mean vote.
Volume 2 Issue 1 (2025) 47 doi: 10.36922/ijamd.8161