
Page 54 - IJAMD-2-1
P. 54
International Journal of AI for
Materials and Design
ML-based MPC for multizone BAC
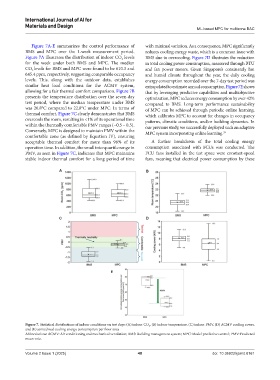
Figure 7A-E summarizes the control performance of with minimal variation. As a consequence, MPC significantly
BMS and MPC over the 1-week measurement period. reduces cooling energy waste, which is a common issue with
Figure 7A illustrates the distribution of indoor CO levels BMS due to overcooling. Figure 7D illustrates the reduction
2
for the week under both BMS and MPC. The median in total cooling power consumption, measured through BTU
CO levels for BMS and MPC were found to be 610.3 and and fan power meters. Given Singapore’s consistently hot
2
645.4 ppm, respectively, suggesting comparable occupancy and humid climate throughout the year, the daily cooling
levels. This, along with the outdoor data, establishes energy consumption recorded over the 7-day test period was
similar heat load conditions for the ACMV system, extrapolated to estimate annual consumption. Figure 7E shows
allowing for a fair thermal comfort comparison. Figure 7B that by leveraging predictive capabilities and multiobjective
presents the temperature distribution over the seven-day optimization, MPC reduces energy consumption by over 42%
test period, where the median temperature under BMS compared to BMS. Long-term performance sustainability
was 20.8°C compared to 22.8°C under MPC. In terms of of MPC can be achieved through periodic online learning,
thermal comfort, Figure 7C clearly demonstrates that BMS which calibrates MPC to account for changes in occupancy
overcools the room, resulting in <1% of its operational time patterns, climatic conditions, and/or building dynamics. In
within the thermally comfortable PMV ranges (−0.5 – 0.5). our previous study, we successfully deployed such an adaptive
Conversely, MPC is designed to maintain PMV within the MPC system incorporating online learning. 39
comfortable zone (as defined by Equation IV), ensuring
acceptable thermal comfort for more than 98% of its A further breakdown of the total cooling energy
operation time. In addition, the small interquartile range in consumption associated with FCUs was conducted. The
PMV, as seen in Figure 7C, indicates that MPC maintains FCU fans installed in the test space were constant-speed
stable indoor thermal comfort for a long period of time fans, meaning that electrical power consumption by these
A B
C D
E
Figure 7. Statistical distributions of indoor conditions on test days: (A) indoor CO 2 , (B) indoor temperature, (C) indoor PMV, (D) ACMV cooling cower,
and (E) annualized cooling energy consumption per floor area
Abbreviations: ACMV: Air conditioning and mechanical ventilation; BMS: Building management system; MPC: Model predictive control; PMV: Predicted
mean vote.
Volume 2 Issue 1 (2025) 48 doi: 10.36922/ijamd.8161