
Page 44 - IJAMD-2-3
P. 44
International Journal of AI for
Materials and Design Biomimetic ML for AFSD aluminum properties
required bonding quality. By studying stress distributions, suggest that higher specific heat values tend to reduce stress
process parameters such as tool rotation speed, feed rate, accumulation. Materials with higher thermal capacity
and applied force can be optimized to ensure uniform appear to distribute heat more uniformly, thereby resulting
deposition and minimize defects. in lower peak stresses. This observation underscores
Logarithmic strain, also known as true strain, is equally the critical role of specific heat in thermal management
important due to the large deformations involved in AFSD. during AFSD. Optimizing this parameter is essential for
Logarithmic strain offers a precise measure of material enhancing thermal stability and determining whether the
deformation, especially in scenarios involving extensive material can withstand thermal stresses without failure.
plastic deformation. Analyzing strain distribution helps In this study, reliable and efficient coupled algorithms
identify regions experiencing high deformation, which were developed by combining decision tree (DT) regression
is critical for ensuring the structural integrity of the and RF regression with GA optimization to predict von
deposited material. Understanding strain behavior also Mises stress and logarithmic strain in the AFSD process.
aids in characterizing the material response under high- The input parameters included elastic modulus, specific
strain and temperature conditions, which is essential for heat, shear translation, shear rotation, and heat source – all
process optimization and achieving the desired material representing key physical and process characteristics of the
properties in the final structure. alloys under consideration. By combining the predictive
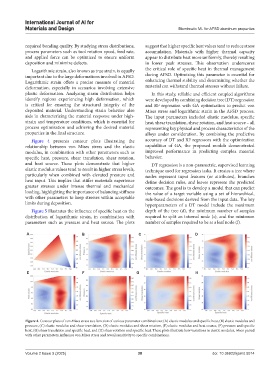
Figure 4 presents contour plots illustrating the accuracy of DT and RF regressors with the optimization
relationship between von Mises stress and the elastic capabilities of GA, the proposed models demonstrated
modulus, in combination with other parameters such as improved performance in predicting complex material
specific heat, pressure, shear translation, shear rotation, behavior.
and heat source. These plots demonstrate that higher DT regression is a non-parametric, supervised learning
elastic modulus values tend to result in higher stress levels, technique used for regression tasks. It creates a tree where
particularly when combined with elevated pressure and nodes represent input features (or attributes), branches
heat input. This implies that stiffer materials experience define decision rules, and leaves represent the predicted
greater stresses under intense thermal and mechanical outcomes. The goal is to develop a model that can predict
loading, highlighting the importance of balancing stiffness the value of a target variable using a set of hierarchical,
with other parameters to keep stresses within acceptable rule-based decisions derived from the input data. The key
limits during deposition. hyperparameters of a DT model include the maximum
Figure 5 illustrates the influence of specific heat on the depth of the tree (d), the minimum number of samples
distribution of logarithmic strain, in combination with required to split an internal node (s), and the minimum
parameters such as pressure and heat source. The plots number of samples required to be at a leaf node (l).
A B C D
E F G H
Figure 4. Contour plots of von Mises stress as a function of various parameter combinations: (A) elastic modulus and specific heat, (B) elastic modulus and
pressure, (C) elastic modulus and shear translation, (D) elastic modulus and shear rotation, (E) elastic modulus and heat source, (F) pressure and specific
heat, (G) shear translation and specific heat, and (H) shear rotation and specific heat. These plots illustrate how variations in elastic modulus, when paired
with other parameters, influence von Mises stress and reveal sensitivity to specific combinations.
Volume 2 Issue 3 (2025) 38 doi: 10.36922/ijamd.5014