
Page 47 - IJAMD-2-3
P. 47
International Journal of AI for
Materials and Design Biomimetic ML for AFSD aluminum properties
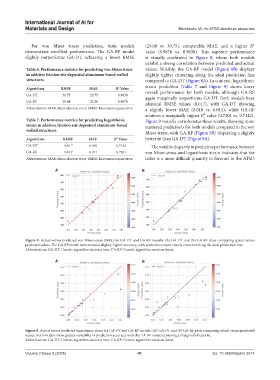
For von Mises stress prediction, both models (29.08 vs. 30.75), comparable MAE, and a higher R²
demonstrate excellent performance. The GA-RF model value (0.9676 vs. 0.9638). This superior performance
slightly outperforms GA-DT, achieving a lower RMSE is visually confirmed in Figure 8, where both models
exhibit a strong correlation between predicted and actual
Table 6. Performance metrics for predicting von Mises stress values. Notably, the GA-RF model (Figure 8B) displays
in additive friction stir deposited aluminum‑based walled slightly tighter clustering along the ideal prediction line
structures compared to GA-DT (Figure 8A). In contrast, logarithmic
Algorithms RMSE MAE R Value strain prediction (Table 7 and Figure 9) shows lower
2
GA-DT 30.75 22.75 0.9638 overall performance for both models, although GA-RF
again marginally outperforms GA-DT. Both models have
GA-RF 29.08 23.20 0.9676 identical RMSE values (0.017), with GA-DT showing
Abbreviations: MAE: Mean absolute error; RMSE: Root mean square error. a slightly lower MAE (0.010 vs. 0.011), while GA-RF
achieves a marginally higher R² value (0.7201 vs. 0.7142).
Table 7. Performance metrics for predicting logarithmic Figure 9 visually corroborates these results, showing more
strain in additive friction stir deposited aluminum‑based scattered predictions for both models compared to the von
walled structures
Mises stress, with GA-RF (Figure 9B) displaying a slightly
Algorithms RMSE MAE R Value better fit than GA-DT (Figure 9A).
2
GA-DT 0.017 0.010 0.7142 The notable disparity in predictive performance between
GA-RF 0.017 0.011 0.7201 von Mises stress and logarithmic strain indicates that the
Abbreviations: MAE: Mean absolute error; RMSE: Root mean square error. latter is a more difficult quantity to forecast in the AFSD
A B
Figure 8. Actual versus predicted von Mises stress (MPa) for GA-DT and GA-RF models: (A) GA-DT and (B) GA-RF plots comparing actual versus
predicted values. The GA-RF model demonstrates slightly higher accuracy, with predictions more closely clustered along the ideal prediction line.
Abbreviations: GA-DT: Genetic algorithm-decision tree; GA-RF: Genetic algorithm-random forest.
A B
Figure 9. Actual versus predicted logarithmic strain for GA-DT and GA-RF models: (A) GA-DT and (B) GA-RF plots comparing actual versus predicted
values. Both models show greater variability in prediction accuracy, with the GA-RF model achieving a marginally better fit.
Abbreviations: GA-DT: Genetic algorithm-decision tree; GA-RF: Genetic algorithm-random forest.
Volume 2 Issue 3 (2025) 41 doi: 10.36922/ijamd.5014