
Page 45 - IJAMD-2-3
P. 45
International Journal of AI for
Materials and Design Biomimetic ML for AFSD aluminum properties
A B C D
E F G H
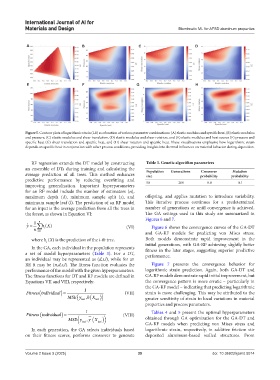
Figure 5. Contour plots of logarithmic strain (LE) as a function of various parameter combinations: (A) elastic modulus and specific heat, (B) elastic modulus
and pressure, (C) elastic modulus and shear translation, (D) elastic modulus and shear rotation, and (E) elastic modulus and heat source (F) pressure and
specific heat (G) shear translation and specific heat, and (H) shear rotation and specific heat. These visualizations emphasize how logarithmic strain
depends on specific heat in conjunction with other process conditions, providing insights into thermal influences on material behavior during deposition.
RF regression extends the DT model by constructing Table 3. Genetic algorithm parameters
an ensemble of DTs during training and calculating the Population Generations Crossover Mutation
average prediction of all trees. This method enhances size probability probability
predictive performance by reducing overfitting and 50 200 0.8 0.1
improving generalization. Important hyperparameters
for an RF model include the number of estimators (n),
maximum depth (d), minimum sample split (s), and offspring, and applies mutation to introduce variability.
minimum sample leaf (l). The prediction of an RF model This iterative process continues for a predetermined
for an input is the average prediction from all the trees in number of generations or until convergence is achieved.
the forest, as shown in Equation VI: The GA settings used in this study are summarized in
Figures 6 and 7.
1 n
()
ˆ y = ∑ hX (VI) Figure 6 shows the convergence curves of the GA-DT
n i= 1 i
and GA-RF models for predicting von Mises stress.
where h (X) is the prediction of the i-th tree. Both models demonstrate rapid improvement in the
i
In the GA, each individual in the population represents initial generations, with GA-RF achieving slightly better
fitness in the later stages, suggesting superior predictive
a set of model hyperparameters (Table 3). For a DT, performance.
an individual may be represented as (d,s,l), while for an
RF, it may be (n,d,s,l). The fitness function evaluates the Figure 7 presents the convergence behavior for
performance of the model with the given hyperparameters. logarithmic strain prediction. Again, both GA-DT and
The fitness functions for DT and RF models are defined in GA-RF models demonstrate rapid initial improvement, but
Equations VII and VIII, respectively: the convergence pattern is more erratic – particularly in
the GA-RF model – indicating that predicting logarithmic
Fitnessindividual 1 (VII) strain is more challenging. This may be attributed to the
MSEy test , hX test greater sensitivity of strain to local variations in material
properties and process parameters.
Fitnessindividual 1 (VIII) Tables 4 and 5 present the optimal hyperparameters
test
MSEy , yX test obtained through GA optimization for the GA-DT and
GA-RF models when predicting von Mises stress and
In each generation, the GA selects individuals based logarithmic strain, respectively, in additive friction stir
on their fitness scores, performs crossover to generate deposited aluminum-based walled structures. From
Volume 2 Issue 3 (2025) 39 doi: 10.36922/ijamd.5014