
Page 89 - IJAMD-2-3
P. 89
International Journal of AI for
Materials and Design SHM using improved CNT-BP and LSTM-NN
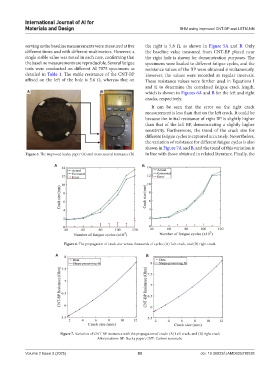
serving as the baseline measurements were measured at five the right is 5.8 Ω, as shown in Figure 5A and B. Only
different times and with different multimeters. However, a the baseline value measured from CNT-BP placed near
single stable value was noted in each case, confirming that the right hole is shown for demonstration purposes. The
the baseline measurements are reproducible. Several fatigue specimens were loaded to different fatigue cycles, and the
tests were conducted on different Al 7075 specimens as resistance values of the BP were obtained simultaneously.
detailed in Table 1. The stable resistance of the CNT-BP However, the values were recorded at regular intervals.
affixed on the left of the hole is 5.6 Ω, whereas that on These resistance values were further used in Equations I
and II to determine the correlated fatigue crack length,
A B which is shown in Figures 6A and B for the left and right
cracks, respectively.
It can be seen that the error on the right crack
measurement is less than that on the left crack. It could be
because the initial resistance of right BP is slightly higher
than that of the left BP, demonstrating a slightly higher
sensitivity. Furthermore, the trend of the crack size for
different fatigue cycles is captured accurately. Nevertheless,
the variation of resistance for different fatigue cycles is also
shown in Figure 7A and B, and the trend of this variation is
Figure 5. The improved bucky paper (A) and its measured resistance (B) in line with those obtained in related literature. Finally, the
A B
Figure 6. The propagation of crack size versus thousands of cycles: (A) Left crack, and (B) right crack.
A B
Figure 7. Variation of CNT-BP resistance with the propagation of crack: (A) Left crack, and (B) right crack
Abbreviations: BP: Bucky paper; CNT: Carbon nanotube.
Volume 2 Issue 3 (2025) 83 doi: 10.36922/IJAMD025310028