
Page 88 - IJAMD-2-3
P. 88
International Journal of AI for
Materials and Design SHM using improved CNT-BP and LSTM-NN
i = ρ(W ⋅ [y , x ] + b) (IV) Table 1. The loading mechanism for the fatigue test
t i t−1 t i
The input gate decides how much of the new information Loading Fatigue test 1 Fatigue Fatigue
should be added to the cell state. The candidate cell state conditions test 2 test 3
can be given as: Load 1–10 kN; R=0.1 1.5–15 kN; 1.5–15 kN;
R=0.1 R=0.1
C = tanh (W ⋅ [y , x ] + b ) (V) Loading 10 Hz 10 Hz 10 Hz
t
c
t−1
c
t
The cell state decides what part of the new candidate frequency
values potentially be added to the cell state. The output gate Fatigue life Test aborted at 760,000 115,087 119,652
is given as: cycles resulting in breakage cycles cycles
o = ρ(W ⋅ [y , x ] + b ) (VI)
t
t
0
t−1
0
The output gate decides what part of the cell state will
be the output at the hidden state h . The cell state is updated
t
in two steps:
i C
C f C t 1 t (VII)
t
t
t
The forget gate controls what to keep or discard from
the past, and the input gate and candidate state add new
information. Finally, the hidden state or the output of the
LSTM cell is computed as:
h = o ⋅tanh (C ) (IX)
t
t
t
This ensures that the hidden state is regulated and is
not just the raw memory value. The experimental study is
discussed in the following section.
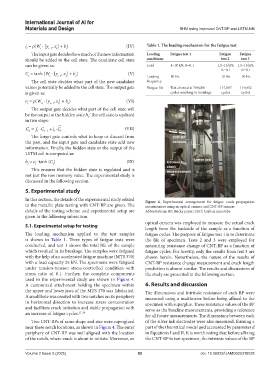
5. Experimental study
In this section, the details of the experimental study related Figure 4. Experimental arrangement for fatigue crack propagation
to the metallic plate testing with CNT-BP are given. The measurement using an optical camera and CNT-BP sensors
details of the testing scheme and experimental setup are Abbreviations: BP: Bucky paper; CNT: Carbon nanotube
given in the following subsection.
optical camera was employed to measure the actual crack
5.1. Experimental setup for testing
length from the backside of the sample as a function of
The loading mechanism applied to the test samples fatigue cycles. The purpose of fatigue test 1 is to determine
is shown in Table 1. Three types of fatigue tests were the life of specimen. Tests 2 and 3 were employed for
conducted, and test 1 shows the total life of the sample measuring resistance change of CNT-BP as a function of
which resulted in its breakage. The samples were fatigued fatigue cycles. For brevity, only the results from test 3 are
with the help of an accelerated fatigue machine (MTS 370) shown herein. Nevertheless, the nature of the results of
with a load capacity 25 kN. The specimens were fatigued CNT-BP resistance change measurement and crack length
under tension-tension stress-controlled condition with prediction is almost similar. The results and discussions of
stress ratio of 0.1. Further, the complete components the study are presented in the following section.
used in the experimental study are shown in Figure 4.
A customized attachment holding the specimen within 6. Results and discussion
the upper and lower jaws of the MTS 370 was fabricated. The dimensions and intrinsic resistance of each BP were
A small hole was created with two notches on its periphery measured using a multimeter before being affixed to the
in horizontal direction to increase stress concentration specimen with superglue. These resistance values of the BP
and facilitate crack initiation and stable propagation with serve as the baseline measurements, providing a reference
an increase of fatigue cycles. 27-29 for all future measurements. The dimensions between each
Two CNT-BPs of same shape and size were superglued of the silver ink electrodes were also measured, forming a
near these notch locations, as shown in Figure 4. The outer part of the theoretical model and accounted by parameter d
periphery of CNT-BP was well aligned with the location in Equations I and II. It is worth noting that before affixing
of the notch, where crack is about to initiate. Moreover, an the CNT-BP to test specimen, the intrinsic values of the BP
Volume 2 Issue 3 (2025) 82 doi: 10.36922/IJAMD025310028