
Page 90 - IJAMD-2-3
P. 90
International Journal of AI for
Materials and Design SHM using improved CNT-BP and LSTM-NN
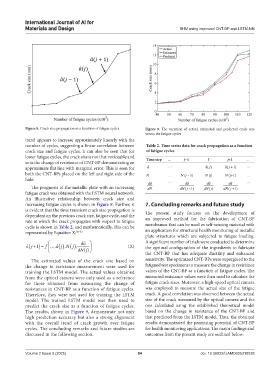
Figure 8. Crack size propagation as a function of fatigue cycles Figure 9. The variation of actual, estimated and predicted crack size
versus the fatigue cycles
trend appears to increase approximately linearly with the
number of cycles, suggesting a linear correlation between Table 2. Time series data for crack propagation as a function
crack size and fatigue cycles. It can also be seen that for of fatigue cycles
lower fatigue cycles, the crack size is not that noticeable and Time step … j−1 J j+1 …
so is the change of resistance of CNT-BP demonstrating an
ˆ()
approximate flat line with marginal error. This is seen for ˆ a … aj ˆ( aj + 1) …
both the CNT-BPs placed on the left and right side of the N … N (j – 1) N (j) N (j+1) …
hole.
ˆ da … ˆ da ˆ da ˆ da …
The prognosis of the metallic plate with an increasing dN dN ( j − 1) dN ( )j dN ( j + 1)
fatigue crack was obtained with the LSTM neural network.
An illustrative relationship between crack size and
increasing fatigue cycles is shown in Figure 8. Further, it 7. Concluding remarks and future study
is evident that the time transient crack size propagation is The present study focuses on the development of
dependent on the previous crack size, fatigue cycle, and the an improved method for the fabrication of CNT-BP
rate at which the crack propagates with respect to fatigue membranes that can be used as self-sensing material with
cycle is shown in Table 2, and mathematically, this can be
represented by Equation X: 30-32 an application for structural health monitoring of metallic
plate structures which are subjected to fatigue loading.
da ˆ A significant number of trials were conducted to determine
( + ˆ aj ) =1 …f , ˆ aj N (X) the optimal configuration of the ingredients to fabricate
( ) ( ), j
,
dN () j the CNT-BP that has adequate ductility and enhanced
The estimated values of the crack size based on sensitivity. The optimized CNT-BPs were superglued to the
the change in resistance measurement were used for fatigued test specimens to measure the change in resistance
training the LSTM model. The actual values obtained values of the CNT-BP as a function of fatigue cycles. The
from the optical camera were only used as a reference measured resistance values were then used to calculate the
for those obtained from measuring the change of fatigue crack sizes. Moreover, a high-speed optical camera
resistances in CNT-BP as a function of fatigue cycles. was employed to measure the actual size of the fatigue
Therefore, they were not used for training the LSTM crack. A good correlation was observed between the actual
model. The trained LSTM model was then used to size of the crack measured by the optical camera and the
predict the crack size as a function of fatigue cycles. one calculated using the established theoretical model
The results, shown in Figure 9, demonstrate not only based on the change in resistance of the CNT-BP and
high prediction accuracy but also a strong alignment that predicted from the LSTM model. Thus, the obtained
with the overall trend of crack growth over fatigue results demonstrated the promising potential of CNT-BP
cycles. The concluding remarks and future studies are for health monitoring applications. The major findings and
discussed in the following section. outcomes from the present study are outlined below:
Volume 2 Issue 3 (2025) 84 doi: 10.36922/IJAMD025310028