
Page 65 - IJB-1-1
P. 65
Ramya Bhuthalingam, Pei Qi Lim, Scott A. Irvine, et al.
can be returned to the printing arm of the robotic Table 1. Displays the depth programmed into the robotic dis-
dispensing unit, and the bioink can be delivered, foll- penser as a Z-axis co-ordinate compared to the obtained depth
owing the etched pattern (Figure 2(G) and (H)). The etched into the polystyrene surface.
Z-axis programming also allowed precision in creating Programmed Depth (µm) Etched groove depth (µm)
the depth of the etched groove down to 180 µm (Table 40 35±7
1 and Figure 3). This allows for some optimization in 90 81±6
the groove depth for different cell types. Furthermore, 180 175±3
the depth of the groove can determine whether the
cells within the grooves can make contact with the surfaces, that the grooves printed close together cau-
cells between and within the neighboring grooves. A sed cells both within and between grooves to align. An
shallow groove can produce a more continuous sheet inter-groove distance of 50 and 100 µm led to the best
of cells whereas the deeper grooves create more dis- cell alignment. When greater distances were applied
tinct lines of cells [14,25] . (250 µm to 1 mm), the cells were not oriented in the di-
It was found, when cells were seeded on the etched rection of the etching (Figure 4). For this study, a gap
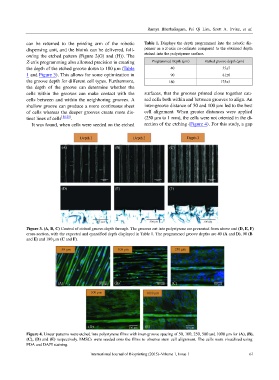
Figure 3. (A, B, C) Control of etched groove depth through. The grooves cut into polystyrene are presented from above and (D, E, F)
cross-section, with the expected and quantified depth displayed in Table 1. The programmed groove depths are 40 (A and D), 90 (B
and E) and 180 µm (C and F).
Figure 4. Linear patterns were etched into polystyrene films with inter-groove spacing of 50, 100, 250, 500 and 1000 µm for (A), (B),
(C), (D) and (E) respectively. hMSCs were seeded onto the films to observe stem cell alignment. The cells were visualized using
FDA and DAPI staining.
International Journal of Bioprinting (2015)–Volume 1, Issue 1 61