
Page 479 - IJB-10-1
P. 479
International Journal of Bioprinting TPMS bone scaffold
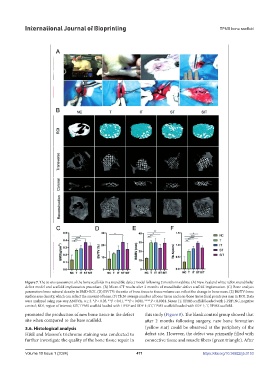
Figure 7. The in vivo assessment of the bone scaffolds in a mandible defect model following 2 months in rabbits. (A) New Zealand white rabbit mandibular
defect model and scaffold implantation procedure. (B) Micro-CT results after 2 months of mandibular defect scaffold implantation. (C) Bone analysis
parameters: bone mineral density in BMD-ROI. (D) BV/TV: the ratio of bone tissue to tissue volume can reflect the change in bone mass. (E) BS/TV: bone
surface area density, which can reflect the amount of bone. (F) Tb.N: average number of bone tissue and non-bone tissue focal points per mm in ROI. Data
were analyzed using one-way ANOVA, n ≥ 3. *P < 0.05, **P < 0.01, ***P < 0.001, ****P < 0.0001. Notes: IT, TPMS scaffold loaded with I-PRF; NC, negative
control; ROI, region of interest; SIT, TPMS scaffold loaded with I-PRF and SDF-1; ST, TPMS scaffold loaded with SDF-1; T, TPMS scaffold.
promoted the production of new bone tissue in the defect this study (Figure 8). The blank control group showed that
site when compared to the base scaffold. after 2 months following surgery, new bone formation
3.6. Histological analysis (yellow star) could be observed at the periphery of the
H&E and Masson’s trichrome staining was conducted to defect site. However, the defect was primarily filled with
further investigate the quality of the bone tissue repair in connective tissue and muscle fibers (green triangle). After
Volume 10 Issue 1 (2024) 471 https://doi.org/10.36922/ijb.0153