
Page 80 - IJB-2-1
P. 80
Microstereolithography-fabricated microneedles for fluid sampling of histamine-contaminated tuna
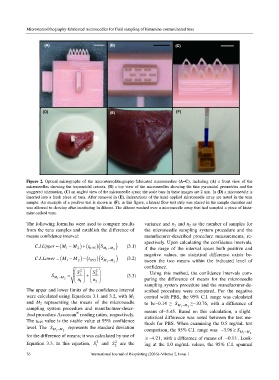
Figure 2. Optical micrographs of the microstereolithography-fabricated microneedles (A–C), including (A) a front view of the
microneedles showing the trapezoidal cutouts, (B) a top view of the microneedles showing the thin pyramidal geometries and the
staggered orientation, (C) an angled view of the microneedle array; the scale bars in these images are 2 mm. In (D) a microneedle is
inserted into a fresh piece of tuna. After removal in (E), indentations of the hand-applied microneedle array are noted in the tuna
sample. An example of a positive test is shown in (F); in this figure, a lateral flow test strip was placed in the sample chamber and
was allowed to develop after incubating in diluent. The diluent washed over a microneedle array that had sampled a piece of hista-
mine-spiked tuna.
The following formulas were used to compare results variance and n 1 and n 2 as the number of samples for
from the tuna samples and establish the difference of the microneedle sampling system procedure and the
means confidence interval: manufacturer-described procedure measurements, re-
spectively. Upon calculating the confidence intervals,
t
+
S
C ..I Upper = (M − 1 M 2 ) ( 0.95 )( M 1 M− 2 ) (3.1) if the range of the interval spans both positive and
negative values, no statistical difference exists be-
−
t
C .. I Lower = (M − 1 M 2 ) ( 0.95 )( M 1 M− 2 ) (3.2) tween the two means within the indicated level of
S
confidence.
S 2 S 2 Using this method, the confidence intervals com-
S M − = 1 + 2 (3.3)
1 M
2
n 1 n 2 paring the difference of means for the microneedle
sampling system procedure and the manufacturer-de-
The upper and lower limits of the confidence interval scribed procedure were compared. For the negative
were calculated using Equations 3.1 and 3.2, with M 1 control with PBS, the 95% C.I. range was calculated
and M 2 representing the means of the microneedle to be −0.14 ≥ S M ≥−10.76, with a difference of
1 M−
2
sampling system procedure and manufacturer-descr- means of −5.45. Based on this calculation, a slight
®
ibed procedure Accuscan reading ratios, respectively. statistical difference was noted between the test me-
The t 0.95 value is the t-table value at 95% confidence thods for PBS. When examining the 0.5 mg/mL test
level. The S M 1 M− 2 represents the standard deviation comparison, the 95% C.I. range was − 3.96 ≥ S
1 M−
M
2
for the difference of means; it was calculated by use of ≥− 4.21, with a difference of means of 0.13− . Look-
2
2
Equation 3.3. In this equation, S and S are the ing at the 1.0 mg/mL values, the 95% C.I. spanned
1
2
76 International Journal of Bioprinting (2016)–Volume 2, Issue 1