
Page 79 - IJB-2-1
P. 79
Ryan D. Boehm, Panupong Jaipan, Kai-Hung Yang, et al
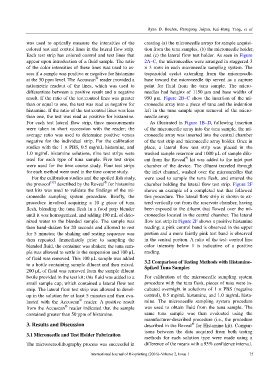
was used to optically measure the intensities of the creating (a) the microneedle arrays for sample acquisi-
colored test and control lines in the lateral flow strip. tion from the tuna samples, (b) the microneedle holder,
Each test strip has colored control and test lines that and (c) the lateral flow test holder. As seen in Figure
appear upon introduction of a fluid sample. The ratio 2A–C, the microneedles were arranged in staggered 3
of the color intensities of these lines was used to as- × 3 rows in each microneedle sampling system. The
sess if a sample was positive or negative for histamine trapezoidal eyelet extending from the microneedle
®
at the 50 ppm level. The Accuscan reader provided a base toward the microneedle tip served as a capture
ratiometric readout of the lines, which was used to point for fluid from the tuna sample. The micro-
differentiate between a positive result and a negative needles had heights of 1150 µm and base widths of
result. If the ratio of the test:control lines was greater 950 µm. Figure 2B–C show the insertion of the mi-
than or equal to one, the test was read as negative for croneedle array into a piece of tuna and the indention
histamine. If the ratio of the test:control lines was less left in the tuna sample upon removal of the micro-
than one, the test was read as positive for histamine. needle array.
For each test lateral flow strip, three measurements As illustrated in Figure 1B–D, following insertion
were taken in short succession with the reader; the of the microneedle array into the tuna sample, the mi-
average ratio was used to determine positive versus croneedle array was inserted into the central chamber
negative for the individual strip. For the calibration of the test strip and microneedle array holder. Once in
studies with the 1 × PBS, 0.5 mg/mL histamine, and place, a lateral flow test strip was placed in the
1.0 mg/mL histamine solutions, nine test strips were washed sample reservoir and 1000 µL of sample dilu-
®
used for each type of tuna sample. Five test strips ent from the Reveal kit was added to the inlet port
were used for the time course study. Four test strips chamber of the device. The diluent traveled through
for each method were used in the time course study. the inlet channel, washed over the microneedles that
For the calibration studies and the spoiled fish study, were used to sample the tuna flesh, and entered the
®
the protocol [32] described by the Reveal for histamine chamber holding the lateral flow test strip. Figure 2F
test kits was used to validate the findings of the mi- shows an example of a completed test that followed
croneedle sampling system procedure. Briefly, the this procedure. The lateral flow strip is shown to ex-
procedure involved acquiring a 10 g piece of tuna tend vertically out from the reservoir chamber, having
flesh, blending the tuna flesh in a food prep blender been exposed to the diluent that flowed over the mi-
until it was homogenized, and adding 190 mL of deio- croneedles located in the central chamber. The lateral
nized water to the blended sample. The sample was flow test strip in Figure 2F shows a positive histamine
then hand-shaken for 20 seconds and allowed to rest reading; a pink control band is observed in the upper
for 5 minutes; the shaking and resting sequence was portion and a more faintly pink test band is observed
then repeated. Immediately prior to sampling the in the central portion. A ratio of the test: control line
blended fluid, the container was shaken; the tuna sam- color intensity below 1 is indicative of a positive
ple was allowed to settle in the suspension and 100 µL reading.
of fluid was removed. This 100 µL sample was added
to a bottle containing sample diluent and then mixed. 3.2 Comparison of Testing Methods with Histamine-
Spiked Tuna Samples
200 µL of fluid was removed from the sample diluent
bottle provided in the test kit; this fluid was added to a For calibration of the microneedle sampling system
small sample cup, which contained a lateral flow test procedure with the tuna flesh, pieces of tuna were in-
strip. The lateral flow test strip was allowed to devel- cubated overnight in solutions of 1 × PBS (negative
op in the solution for at least 5 minutes and then eva- control), 0.5 mg/mL histamine, and 1.0 mg/mL hista-
®
luated with the Accuscan reader. A positive result mine. The microneedle sampling system procedure
®
from the Accuscan reader indicated that the sample was used to obtain fluid from the tuna sample. The
contained greater than 50 ppm of histamine. same tuna sample was then evaluated using the
manufacturer-described procedure (i.e., the procedure
3. Results and Discussion described in the Reveal for Histamine kit). Compar-
®
isons between the data acquired from both testing
3.1 Microneedle and Test Holder Fabrication
methods for each solution type were made using a
The microstereolithography process was successful in difference of the means with a 95% confidence interval.
International Journal of Bioprinting (2016)–Volume 2, Issue 1 75