
Page 81 - IJB-2-1
P. 81
Ryan D. Boehm, Panupong Jaipan, Kai-Hung Yang, et al
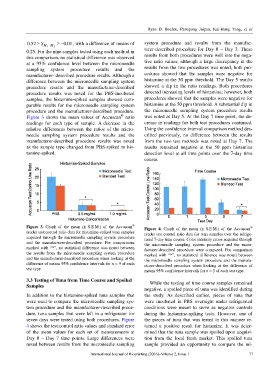
0.52 ≥ S M − 2 ≥− 0.01, with a difference of means of system procedure and results from the manufac-
1 M
0.25. For the nine samples tested using each method in turer-described procedure for Day 0 – Day 3. These
this comparison, no statistical difference was observed results from both procedures were well into the nega-
at a 95% confidence level between the microneedle tive ratio values; although a large discrepancy in the
sampling system procedure results and the results from the two procedures was noted, both pro-
manufacturer- described procedure results. Although a cedures showed that the samples were negative for
difference between the microneedle sampling system histamine at the 50 ppm threshold. The Day 5 results
procedure results and the manufacturer-described showed a dip in the ratio readings. Both procedures
procedure results was noted for the PBS-incubated detected increasing levels of histamine; however, both
samples, the histamine-spiked samples showed com- procedures showed that the samples were negative for
parable results for the microneedle sampling system histamine at the 50 ppm threshold. A substantial dip in
procedure and the manufacturer-described procedure. the microneedle sampling system procedure results
®
Figure 3 shows the mean values of Accuscan ratio was noted at Day 5. At the Day 7 time point, the de-
readings for each type of sample. A decrease in the crease in readings for both test procedures continued.
relative differences between the ratios of the micro- Using the confidence interval comparison method des-
needle sampling system procedure results and the cribed previously, no difference between the results
manufacturer-described procedure results was noted from the two test methods was noted at Day 7. The
as the sample type changed from PBS-spiked to his- results remained negative at the 50 ppm histamine
tamine-spiked. detection level at all time points over the 7-day time
course.
®
Figure 3. Graph of the mean (± S.E.M.) of the Accuscan Figure 4. Graph of the mean (± S.E.M.) of the Accuscan
®
reader test:control ratio data for histamine-spiked tuna samples reader test:control ratio data for tuna samples over the refrige-
acquired through the microneedle sampling system procedure rated 7-day time course. Color intensity ratios acquired through
and the manufacturer-described procedure. For comparisons the microneedle sampling system procedure and the manu-
marked with “*”, no statistical difference was noted between facturer-described procedure were compared. For comparison
the results from the microneedle sampling system procedure marked with “*”, no statistical difference was noted between
and the manufacturer-described procedure when looking at the the microneedle sampling system procedure and the manufa-
difference of means 95% confidence intervals for n = 9 of each cturer-described procedure when looking at the difference of
test type. means 95% confidence intervals for n = 5 of each test type.
3.3 Testing of Tuna from Time Course and Spoiled While the testing of time course samples remained
Samples
negative, a spoiled piece of tuna was identified during
In addition to the histamine-spiked tuna samples that the study. As described earlier, pieces of tuna that
were used to compare the microneedle sampling sys- were incubated in PBS overnight under refrigerated
tem procedure and the manufacturer-described proce- conditions were meant to serve as negative controls
dure, tuna samples that were left in a refrigerator for during the histamine-spiking tests. However, one of
seven days were tested using both procedures. Figure the pieces of tuna that was tested in this manner re-
4 shows the test:control ratio values and standard error turned a positive result for histamine. It was deter-
of the mean values for each set of measurements at mined that the tuna sample was spoiled upon acquisi-
Day 0 – Day 7 time points. Large differences were tion from the local fresh market. This spoiled tuna
noted between results from the microneedle sampling sample provided an opportunity to compare the mi-
International Journal of Bioprinting (2016)–Volume 2, Issue 1 77