
Page 456 - IJB-10-2
P. 456
International Journal of Bioprinting 3D-printed bioceramic scaffolds for bone regeneration
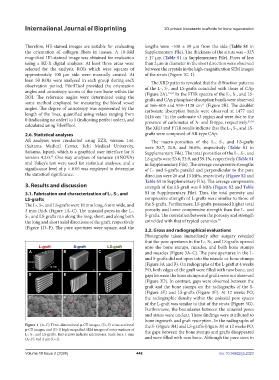
Therefore, HE-stained images are suitable for evaluating lengths were ~538 ± 39 µm from the side (Table S1 in
the orientation of collagen fibers in tissues. A 10-fold Supplementary File). The thickness of the struts was ~325
magnified HE-stained image was obtained for evaluation ± 17 µm (Table S1 in Supplementary File). Pores of less
using a BZ-X digital analyzer. At least three areas were than 2 µm in diameter in the short direction were observed
selected for the analysis. ROIs which were squares of between the crystals in the high-magnification SEM images
approximately 100 µm side were manually created. At of the struts (Figure 1G–I).
least 50 ROIs were analyzed in each group during each The XRD patterns revealed that the diffraction patterns
observation period. FibrilTool provided the orientation of the L-, S-, and LS-grafts coincided with those of CAp
angles and anisotropy scores of the new bone within the (Figure 2A). 33,34 In the FTIR spectra of the L-, S-, and LS-
ROI. The reference angles were determined using the grafts and CAp, phosphate absorption bands were observed
same method employed for measuring the blood vessel at 566–605 and 959–1128 cm (Figure 2B). The doublet
–1
angles. The degree of anisotropy was represented by the carbonate absorption bands were observed at 1477 and
length of the lines, quantified using values ranging from 1416 cm in the carbonate ν3 region and were due to the
–1
0 (indicating no order) to 1 (indicating perfect order), and presence of carbonates of A- and B-type, respectively. 33,34
calculated using FibrilTool. The XRD and FTIR results indicate that the L-, S-, and LS-
2.6. Statistical analyses grafts were composed of AB-type CAp.
All analyses were conducted using EZR, version 1.61 The macro-porosities of the L-, S-, and LS-grafts
(Saitama Medical Center, Jichi Medical University, were 30.7, 31.8, and 36.6%, respectively (Table S1 in
Saitama, Japan), which is a graphical user interface for R Supplementary File). The total porosities of the L-, S-, and
version 4.2.0. One-way analyses of variance (ANOVA) LS-grafts were 53.6, 53.9, and 59.1%, respectively (Table S1
32
and Tukey’s test were used for statistical analyses, and a in Supplementary File). The average compressive strengths
significance level of p < 0.05 was employed to determine of L- and S-grafts parallel and perpendicular to the pore
the statistical significance. direction were 26 and 13 MPa, respectively (Figure S2 and
Table S1 in Supplementary File). The average compressive
3. Results and discussion strength of the LS-graft was 8 MPa (Figure S2 and Table
3.1. Fabrication and characterization of L-, S-, and S1 in Supplementary File). Thus, the total porosity and
LS-grafts compressive strength of L-grafts were similar to those of
The L-, S-, and LS-grafts were 10 mm long, 6 mm wide, and the S-grafts. Furthermore, LS-grafts possessed higher total
3 mm thick (Figure 1A–C). The uniaxial pores in the L-, porosity and lower compressive strength than the L- and
S-, and LS-grafts run along the long, short, and along both S-grafts. The correlation between the porosity and strength
the long and short axial directions of the graft, respectively coincided with that of typical ceramics. 35
(Figure 1D–F). The pore apertures were square, and the
3.2. Gross and radiographical evaluations
Photographs taken immediately after surgery revealed
that the pore apertures in the L-, S-, and LS-grafts opened
onto the bone stumps, muscles, and both bone stumps
and muscles (Figure 3A–C). The pore apertures in the L-
and S-grafts did not open into the muscle or bone stumps
(Figure 3A and B). On radiographs of the L-graft at 4 weeks
PO, both edges of the graft were filled with new bone, and
gaps between the bone stumps and grafts were not observed
(Figure 3D). In contrast, gaps were observed between the
graft and the bone stumps on the radiographs of the S-
(Figure 3E) and LS-grafts (Figure 3F). At 12 weeks PO,
the radiographic density within the uniaxial pore spaces
of the L-graft was similar to that of the struts (Figure 3G).
Furthermore, the boundaries between the uniaxial pores
and struts were unclear. These findings were attributed to
bone ingrowth and graft resorption. In the radiographs of
Figure 1. (A–C) Three-dimensional µ-CT images, (D–F) cross-sectional the S- (Figure 3H) and LS-grafts (Figure 3I) at 12 weeks PO,
µ-CT images, and (G–I) high-magnified SEM images of outer surfaces of the gaps between the bone stumps and grafts disappeared
L-, S-, and LS-grafts. Red arrows indicate micropores. Scale bars: 1 mm
(A–F), and 2 µm (G–I). and were filled with new bone. Although the pore sizes in
Volume 10 Issue 2 (2024) 448 doi: 10.36922/ijb.2323