
Page 457 - IJB-10-2
P. 457
International Journal of Bioprinting 3D-printed bioceramic scaffolds for bone regeneration
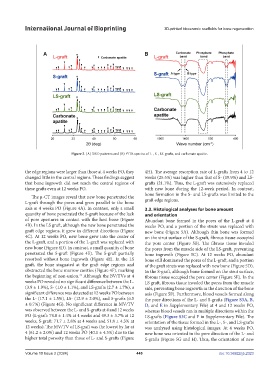
Figure 2. (A) XRD patterns and (B) FTIR spectra of L-, S-, LS-grafts, and carbonate apatite.
the edge regions were larger than those at 4 weeks PO, they 4H). The average resorption rate of L-grafts from 4 to 12
changed little in the central regions. These findings suggest weeks (25.5%) was higher than that of S- (19.9%) and LS-
that bone ingrowth did not reach the central regions of grafts (21.1%). Thus, the L-graft was extensively replaced
these grafts even at 12 weeks PO. with new bone during the 12-week period. In contrast,
bone formation in the S- and LS-grafts was limited to the
The µ-CT images reveal that new bone penetrated the
L-graft through the pores and grew parallel to the bone graft edge regions.
axis at 4 weeks PO (Figure 4A). In contrast, only a small 3.3. Histological analyses for bone amount
quantity of bone penetrated the S-graft because of the lack and orientation
of pore apertures in contact with the host bone (Figure Abundant bone formed in the pores of the L-graft at 4
4B). In the LS graft, although the new bone penetrated the weeks PO, and a portion of the struts was replaced with
graft edge regions, it grew in different directions (Figure new bone (Figure 5A). Although thin bone was formed
4C). At 12 weeks PO, new bone grew into the center of on the strut surface of the S-graft, fibrous tissue occupied
the L-graft, and a portion of the L-graft was replaced with the pore center (Figure 5B). The fibrous tissue invaded
new bone (Figure 4D). In contrast, a small quantity of bone the pores from the muscle side of the LS-graft, preventing
penetrated the S-graft (Figure 4E). The S-graft partially bone ingrowth (Figure 5C). At 12 weeks PO, abundant
resorbed without bone ingrowth (Figure 4E). In the LS bone still dominated the pores of the L-graft, and a portion
graft, the bone stagnated at the graft edge regions and of the graft struts was replaced with new bone (Figure 5D).
obstructed the bone marrow cavities (Figure 4F), marking In the S-graft, although bone formed on the strut surface,
the beginning of non-union. Although the BV/TVs at 4 fibrous tissue occupied the pore center (Figure 5E). In the
35
weeks PO revealed no significant difference between the L- LS graft, fibrous tissue invaded the pores from the muscle
(3.9 ± 1.9%), S- (1.0 ± 1.1%), and LS-grafts (2.7 ± 1.7%), a side, preventing bone ingrowth in the direction of the bone
significant difference was detected at 12 weeks PO between axis (Figure 5F). Furthermore, blood vessels formed along
the L- (17.1 ± 1.5%), LS- (12.9 ± 2.0%), and S-grafts (6.5 the pore directions of the L- and S-grafts (Figure S3A, B,
± 0.7%) (Figure 4G). No significant difference in MV/TV D, and E in Supplementary File) at 4 and 12 weeks PO,
was observed between the L- and S-grafts at 4 and 12 weeks whereas blood vessels ran in multiple directions within the
PO (L-graft: 74.8 ± 1.4% at 4 weeks and 49.3 ± 3.7% at 12 LS-grafts (Figure S3C and F in Supplementary File). The
weeks, S-graft: 71.7 ± 2.8% at 4 weeks and 51.8 ± 4.3% at orientation of the tissue formed in the L-, S-, and LS-grafts
12 weeks). The MV/TV of LS-graft was the lowest by far at was analyzed using histological images. At 4 weeks PO,
4 (61.2 ± 2.0%) and 12 weeks PO (40.1 ± 4.3%) due to the new bone was oriented in the pore direction of the L- and
higher total porosity than those of L- and S-grafts (Figure S-grafts (Figure 5G and H). Thus, the orientation of new
Volume 10 Issue 2 (2024) 449 doi: 10.36922/ijb.2323