
Page 511 - IJB-10-2
P. 511
International Journal of Bioprinting Oozing 3D-printed scaffolds for tissue engineering
(Rhinoceros). Control group (Gof) was designed with CAD displacements of the nozzle on an X–Y plane, and then
software, and Gy group was designed with Ultimaker Cura iterating different patterns at every layer of the Z axis. These
(v4.8.0, Ultimaker) slicer. All specimens were prepared displacements were generated and developed in Silkworm
for 3D printing with Ultimaker Cura (v4.8.0, Ultimaker) plugin by designing different tool paths (Figure 2C and D).
(Figure S1 in Supplementary File). The Os specimen was designed by creating a grid of 8 × 8
The oozing print methodology was based on depositing square spaces on a 10 × 10 mm X–Y plane (Figure 2B1 and
a small drop of extruded material on a certain coordinate, B2). The X–Y planes were stacked along the Z axis, and
then moving the nozzle to the next coordinate without each layer was rotated 90° from the previous one enabling
extruding any material between both points. This method the creation of the whole volume. The specimen was
allows the generation of oozing fiber. The Or specimen printed using the identical oozing methodology as with the
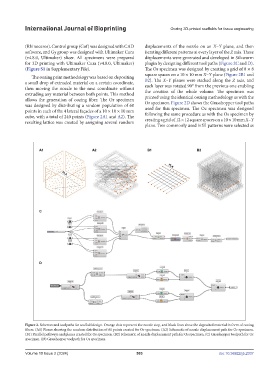
was designed by distributing a random population of 60 Or specimen. Figure 2D shows the Grasshopper tool paths
points in each of the 4 lateral façades of a 10 × 10 × 10 mm used for this specimen. The Oc specimen was designed
cube, with a total of 240 points (Figure 2A1 and A2). The following the same procedure as with the Os specimen by
resulting lattice was created by assigning several random creating a grid of 12 × 12 square spaces on a 10 × 10 mm X–Y
plane. Two commonly used infill patterns were selected as
Figure 2. Schemes and toolpaths for scaffold design. Orange dots represent the nozzle stop, and black lines show the deposited material in form of oozing
fibers. (A1) Planes showing the random distribution of 60 points created for Or specimen. (A2) Schematic of nozzle displacement path for Or specimen.
(B1) Parallel pathways and planes created for Os specimen. (B2) Schematic of nozzle displacement path for Os specimen. (C) Grasshopper toolpath for Or
specimen. (D) Grasshopper toolpath for Os specimen.
Volume 10 Issue 2 (2024) 503 doi: 10.36922/ijb.2337