
Page 514 - IJB-10-2
P. 514
International Journal of Bioprinting Oozing 3D-printed scaffolds for tissue engineering
1 2
Percent (%) Percent (%)
A
Percent (%) Percent (%)
B
Percent (%) Percent (%)
C
Percent (%) Percent (%)
D
Percent (%) Percent (%)
E
Range (μm) Range (μm)
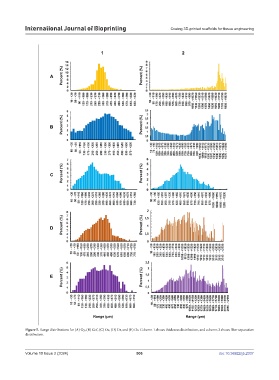
Figure 5. Range distributions for (A) Gy, (B) Gof, (C) Oc, (D) Or, and (E) Os. Column 1 shows thickness distribution, and column 2 shows fiber separation
distribution.
Volume 10 Issue 2 (2024) 506 doi: 10.36922/ijb.2337