
Page 519 - IJB-10-2
P. 519
International Journal of Bioprinting Oozing 3D-printed scaffolds for tissue engineering
FIG.9 CELL CULTURES & CONFOCAL
International Journal of Bioprinting
http://doi.org/10.18063/ijb.XXXXXXXXXXXXX
A Gy Gof Oc E
Figure 9
Cell culture assays. (A) Representative immunofluorescence
images of confocal microscopy of cell culture onto the different
scaffolds (Gy, Gof, Oc, Or, and Os) and in control (TCP) at day 7
after seeding. Nucleus stained with DAPI and cytoskeleton with
Phalloidin. Scale bar indicates 150 um. (B) Metabolic activity at
days 1, 3, and 7 (n=3, p<0.05 Mann Whitney).
Or Os TCP
B
1000 *
*
900
800
Metabolic activity (%) 600 Day 1
700
500
Day 3
400
Day 7
300
200
100 *
0
Gy Gof Oc Or Os TCP
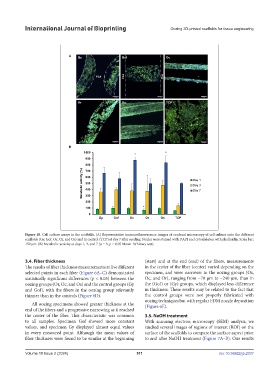
Figure 10. Cell culture assays in the scaffolds. (A) Representative immunofluorescence images of confocal microscopy of cell culture onto the different
scaffolds (Gy, Gof, Oc, Or, and Os) and in control (TCP) at day 7 after seeding. Nuclei were stained with DAPI and cytoskeleton with phalloidin. Scale bar:
Figure 10. Cell culture assays in the scaffolds. (A) Representative immunofluorescence images of
150 µm. (B) Metabolic activity at days 1, 3, and 7 (n = 3, p < 0.05 Mann–Whitney test).
confocal microscopy of cell culture onto the different scaffolds (Gy, Gof, Oc, Or, and Os) and in control
(TCP) at day 7 after seeding. Nuclei were stained with DAPI and cytoskeleton with phalloidin. Scale bar:
3.4. Fiber thickness (start) and at the end (end) of the fibers, measurements
150 µm. (B) Metabolic activity at days 1, 3, and 7 (n = 3, p < 0.05 Mann–Whitney test).
The results of fiber thickness measurements at five different in the center of the fiber (center) varied depending on the
selected points in each fiber (Figure 6A–C) demonstrated specimen, and were narrower in the oozing groups (Os,
statistically significant differences (p < 0.05) between the Oc, and Or), ranging from ~70 µm to ~240 µm, than in
oozing groups (Or, Oc, and Os) and the control groups (Gy the (Gof) or (Gy) groups, which displayed less difference
and Gof), with the fibers in the oozing group relevantly in thickness. These results may be related to the fact that
thinner than in the controls (Figure 6D). the control groups were not properly fabricated with
All oozing specimens showed greater thickness at the oozing techniques but with regular FDM nozzle deposition
(Figure 6E).
end of the fibers and a progressive narrowing as it reached
the center of the fiber. This characteristic was common 3.5. NaOH treatment
to all samples. Specimen Gof showed more constant With scanning electron microscopy (SEM) analysis, we
values, and specimen Gy displayed almost equal values studied several images of regions of interest (ROI) on the
in every measured point. Although the mean values of surface of the scaffolds to compare the surface aspect prior
fiber thickness were found to be similar at the beginning to and after NaOH treatment (Figure 7A–B). Our results
Volume 10 Issue 2 (2024) 511 doi: 10.36922/ijb.2337