
Page 518 - IJB-10-2
P. 518
International Journal of Bioprinting Oozing 3D-printed scaffolds for tissue engineering
A B
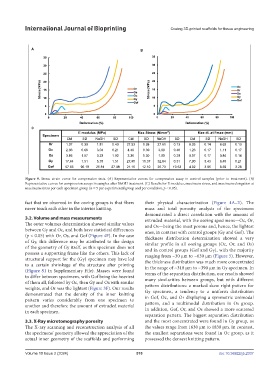
Stress (MPa) Stress (MPa)
Deformation (% ) Deformation (% )
C
2
E modulus (MPa) Max Stress (N/mm ) Max dL at Fmax (mm)
Specimen
Ctrl SD NaOH SD Ctrl SD NaOH SD Ctrl SD NaOH SD
Or 1.97 0.30 1.81 0.40 27.93 0.38 27.61 0.13 8.35 0.14 8.62 0.13
Oc 2.86 0.68 3.04 0.21 4.49 0.39 3.99 0.48 1.26 0.17 1.11 0.17
Os 3.85 1.57 3.23 1.02 2.36 0.30 1.93 0.29 0.97 0.17 0.84 0.14
Gy 17.64 1.51 5.78 1.51 27.90 11.37 32.84 0.31 7.00 3.43 8.48 0.21
Gof 57.56 95.19 25.31 27.08 21.15 12.10 25.73 10.53 4.92 3.85 6.59 3.26
Figure 9. Stress–strain curve for compression tests. (A) Representative curves for compression assay in control samples (prior to treatment). (B)
Representative curves for compression assays in samples after NaOH treatment. (C) Results for E modulus, maximum stress, and maximum elongation at
maximum stress per each specimen group (n = 5 per experimental group and per condition, p < 0.05).
fact that we observed in the oozing groups is that fibers their physical characterization (Figure 4A–E). The
never touch each other in the interior knitting. mass and total porosity analysis of the specimens
demonstrated a direct correlation with the amount of
3.2. Volume and mass measurements extruded material, with the oozing specimens—Oc, Or,
The outer volumes determination showed similar values and Os—being the most porous and, hence, the lightest
between Gy and Oc, and both have statistical differences ones, in contrast with control groups (Gy and Gof). The
(p < 0.05) with Or, Os, and Gof (Figure 4F). In the case thickness distribution determination showed a very
of Gy, this difference may be attributed to the design similar profile in all oozing groups (Oc, Or, and Os)
of the geometry of Gy itself, as this specimen does not and in control groups (Gof and Gy), with the majority
possess a supporting frame like the others. This lack of ranging from ~30 µm to ~630 µm (Figure 5). However,
structural support for the (Gy) specimen may have led the thickness distribution was much more concentrated
to a certain shrinkage of the structure after printing in the range of ~310 µm to ~390 µm in Gy specimen. In
(Figure S1 in Supplementary File). Masses were found terms of the separation distribution, our results showed
to differ between specimens, with Gof being the heaviest
of them all, followed by Oc, then Gy and Os with similar many similarities between groups, but with different
pattern distributions: a marked skew right pattern for
weights, and Or was the lightest (Figure 3F). Our results
demonstrated that the density of the inner knitting Gy specimen, a tendency to a uniform distribution
pattern varies considerably from one specimen to in Gof, Oc, and Or displaying a symmetric unimodal
another and therefore the amount of extruded material pattern, and a multimodal distribution in Os group.
in each specimen. In addition, Gof, Or, and Os showed a more scattered
separation pattern. The biggest separation distribution
3.3. X-Ray microtomography porosity and the most concentrated were found in Gy group, as
The X-ray scanning and reconstruction analysis of all the values range from 1630 µm to 1830 µm. In contrast,
the specimens’ geometry allowed the appreciation of the the smallest separations were found in Oc group, as it
actual inner geometry of the scaffolds and performing possessed the densest knitting pattern.
Volume 10 Issue 2 (2024) 510 doi: 10.36922/ijb.2337