
Page 517 - IJB-10-2
P. 517
International Journal of Bioprinting Oozing 3D-printed scaffolds for tissue engineering
A
Day 0 Day 1
Day 2 Day 9
B 100 ¶ 
90 * *
Contact angle (º) 70 * * ¶ 
80
60
50
40
30
20 Ctrl
NaOH
10
0
Day 0 Day 1 Day 2 Day 9
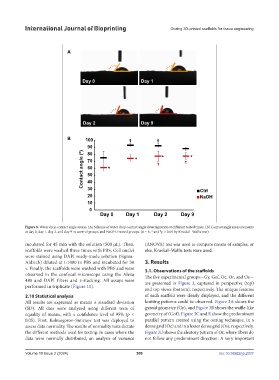
Figure 8. Water drop contact angle assays. (A) Scheme of water drop contact angle determination at different tested times. (B) Contact angle measurements
at day 0, day 1, day 2, and day 9 in control groups and NaOH-treated groups. (n = 6, * and p < 0.05 by Kruskal–Wallis test)
incubated for 45 min with the solution (500 µL). Then, (ANOVA) test was used to compare means of samples, or
scaffolds were washed three times with PBS. Cell nuclei else, Kruskal–Wallis tests were used.
were stained using DAPI ready-made solution (Sigma-
Aldrich) diluted at 1:1000 in PBS and incubated for 30 3. Results
s. Finally, the scaffolds were washed with PBS and were 3.1. Observations of the scaffolds
observed in the confocal microscope using the Alexa The five experimental groups—Gy, Gof, Oc, Or, and Os—
488 and DAPI filters and z-stacking. All assays were are presented in Figure 3, captured in perspective (top)
performed in triplicate (Figure 10).
and top views (bottom), respectively. The unique features
2.10 Statistical analysis of each scaffold were clearly displayed, and the different
All results are expressed as means ± standard deviation knitting patterns could be observed. Figure 3A shows the
(SD). All data were analyzed using different tests of gyroid geometry (Gy), and Figure 3B shows the waffle-like
equality of means, with a confidence level of 95% (p < geometry of (Gof). Figure 3C and E show the predominant
0.05). First, Kolmogorov–Smirnov test was deployed to parallel pattern created using the oozing technique, in a
assess data normality. The results of normality tests dictate dense grid (Oc) and in a lesser dense grid (Os), respectively.
the different methods used for testing: in cases where the Figure 3D shows the aleatory pattern of Or, where fibers do
data were normally distributed, an analysis of variance not follow any predominant direction. A very important
Volume 10 Issue 2 (2024) 509 doi: 10.36922/ijb.2337