
Page 512 - IJB-10-2
P. 512
International Journal of Bioprinting Oozing 3D-printed scaffolds for tissue engineering
control groups: a gyroid geometry (Gy) and waffle-like 2.3. Porosity determination by
geometry (Gof). The Gy specimen was generated using the X-ray microtomography
gyroid infill form in Ultimaker Cura software creating four Porosity was measured using a Skyscan 1272 micro-CT
iterations in a 10 × 10 × 10 mm cube. The Gof sample was (Bruker) at a 10 mm resolution. The X-ray source peak
designed in SolidWorks (Dassault Systemes) as a 10 × 10 voltage was 50 kV with an intensity of 200 µA, 180°
× 10 mm cube with an internal matrix of 5 × 5 equidistant scanning, and a 0.2° step. The porosity was obtained
holes of 1 × 1 mm. using the CTAn software provided by Bruker. Ranges of
thickness and separation distributions were also analyzed
2.2 Three-dimensional printing of scaffolds within this study (Figures 4 and 5).
All scaffolds were 3D-printed using an Ender-5 Pro
printer (Creality 3D) equipped with a 0.4 mm nozzle 2.4. Fiber thickness analysis
and using 1.75 mm diameter PLA filament (Smartfil, Fiber thickness was measured using a stereomicroscope
Smartmaterials 3D), 210°C extrusion temperature, (StereoBlue SB 1903, Euromex) with a digital camera (CMEX
60°C bed temperature, and 0.2 mm layer height. The DC5000f, Euromex). Measurements were performed using
printing speed was 80 mm/s for the control groups, with the software ImageFocus Plus V2 (Euromex). For each
a feed rate of 1200 and constant flow rate. For the oozing experimental group, three samples were fabricated at five
groups, the printing speed was 59 mm/s, whereas the different heights (2 mm, 4 mm, 6 mm, 8 mm, and 10 mm)
feed rate and the flow rate were set by Silkworm plugin by directly stopping the 3D printer when the height of the
(see Figure S2 for G-codes). For controls (Gy and Gof), sample reached the desired value. A total of three fibers
G-codes were generated with Ultimaker Cura, with the were randomly selected at these five different heights per
.STL files imported beforehand. For experimental groups specimen. The thickness was measured at five points along
(Or, Os, and Oc), the G-codes were directly obtained each fiber: start (at the very beginning of the fiber), mid1
and exported from Silkworm plugin (Grasshopper3d). (an equidistant point from the middle and the start), center
After printing, all specimens were characterized, with the (at the middle point of the fiber), mid2 (an equidistant
volume (x, y, and z) measured using a vernier caliper and point from the middle and the end), and end (a point very
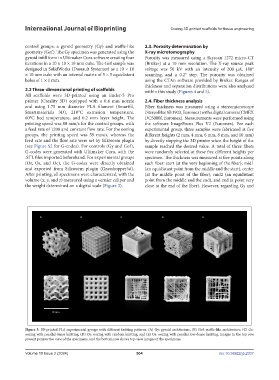
the weight determined on a digital scale (Figure 3). close to the end of the fiber). However, regarding Gy and
A B C D E
10 mm
Figure 3. 3D-printed PLA experimental groups with different knitting patterns. (A) Gy: gyroid architecture; (B) Gof: waffle-like architecture; (C) Oc:
oozing with parallel dense knitting; (D) Or: oozing with random knitting; and (E) Os: oozing with parallel low-dense knitting. Images in the top row
present perspective view of the specimens, and the bottom row shows top-view images of the specimens.
Volume 10 Issue 2 (2024) 504 doi: 10.36922/ijb.2337