
Page 79 - IJB-3-1
P. 79
Hang Liu, Sanjairaj Vijayavenkataraman, Dandan Wang, et al.
plied between the nozzle and the substrate, charges tivity of medium, thus changing the surface tension
will be induced within the solution. When a small vo- and electrostatic force under the applied electrical
lume of electrically conductive droplet is exposed to force.
an electric field, the shape of the droplet starts to de-
form from the shape caused by surface tension alone. 2.5 Stage Motion Characterization
When a certain threshold voltage has been reached, Effective fabrication area represents the part of the
the slightly rounded tip inverts and emits a jet of liquid. scaffold, which was fabricated when the actual robotic
(iii) Nozzle-to-substrate distance (D): In a conven- stage speed approximately equals to the preset stage
tional EHD-spinning process, the nozzle to substrate speed. In this study, a rectilinear raster pattern
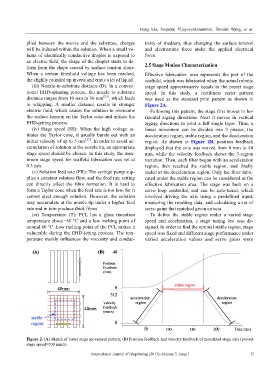
distance ranges from 10 mm to 30 mm [24] , which leads was used as the standard print pattern as shown in
to whipping. A smaller distance results in stronger Figure 2A.
electric field, which causes the solution to overcome Following this pattern, the stage first moves in ho-
the surface tension on the Taylor cone and initiate the rizontal zigzag directions. Next it moves in vertical
EHD-jetting process. zigzag directions to print a full single layer. Thus, a
(iv) Stage speed (SS): When the high voltage in- linear movement can be divided into 3 phases, the
itiates the Taylor cone, it usually bursts out with an acceleration region, stable region, and the deceleration
initial velocity of up to 5 m/s [25] . In order to avoid ac- region. As shown in Figure 2B, position feedback
cumulation of solution at the nozzle tip, an appropriate displayed that the axis was moved from 0 mm to 40
stage speed should be chosen. In this study, the max- mm, while the velocity feedback shows the 3-region
imum stage speed for scaffold fabrication was set at variation. Then, each fiber began with an acceleration
0.3 m/s. region, then reached the stable region, and finally
(v) Solution feed rate (FR): The syringe pump sup- ended at the deceleration region. Only the fiber fabri-
plies a constant solution flow, and the feed rate setting cated under the stable region can be considered as the
can directly affect the fibre formation. It is hard to effective fabrication area. The stage was built on a
form a Taylor cone when the feed rate is too low, for it servo loop controller, and can be auto-tuned, which
cannot eject enough solution. However, the solution involved driving the axis using a predefined input,
may accumulate at the nozzle tip under a higher feed measuring the resulting data, and calculating a set of
rate and in turn produce thick fibres. servo gains that matched given criteria.
(vi) Temperature (T): PCL has a glass transition To define the stable region under a varied stage
temperature about −60 °C and a low melting point of speed and acceleration, a stage tuning test was de-
around 60 °C. Low melting point of the PCL makes it signed. In order to find the optimal stable region, stage
vulnerable during the EHD-jetting process. The tem- speed was fixed and different stage performance under
perature mainly influences the viscosity and conduc- varied acceleration values and servo gains were
Figure 2. (A) Sketch of raster stage movement pattern; (B) Position feedback and velocity feedback of motorized stage axis (pre-set
stage speed=300 mm/s).
International Journal of Bioprinting (2017)–Volume 3, Issue 1 75