
Page 83 - IJB-3-1
P. 83
Hang Liu, Sanjairaj Vijayavenkataraman, Dandan Wang, et al.
speed, namely at 100 mm/s and 250 mm/s. 3.3 Multilayer Scaffold Fabrication
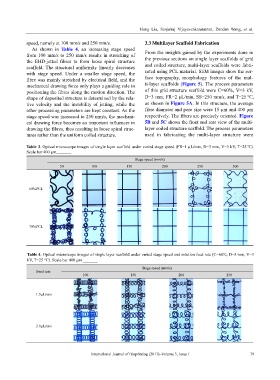
As shown in Table 4, an increasing stage speed
from 100 mm/s to 250 mm/s results in stretching of From the insights gained by the experiments done in
the EHD-jetted fibres to form loose spiral structure the previous sections on single layer scaffolds of grid
scaffold. The structural uniformity linearly decreases and coiled structure, multi-layer scaffolds were fabri-
with stage speed. Under a smaller stage speed, the cated using PCL material. SEM images show the sur-
fibre was mainly stretched by electrical field, and the face topography, morphology features of the mul-
mechanical drawing force only plays a guiding role in ti-layer scaffolds (Figure 5). The process parameters
positioning the fibres along the motion direction. The of this grid structure scaffold were C=60%, V=3 kV,
shape of deposited structure is determined by the rela- D=3 mm, FR=2 μL/min, SS=250 mm/s, and T=25 °C,
tive velocity and the instability of jetting, while the as shown in Figure 5A. In this structure, the average
other processing parameters are kept constant. As the fibre diameter and pore size were 15 μm and 400 μm
stage speed was increased to 250 mm/s, the mechani- respectively. The fibers are precisely oriented. Figure
cal drawing force becomes an important influencer in 5B and 5C shows the front and rear view of the multi-
drawing the fibres, thus resulting in loose spiral struc- layer coiled structure scaffold. The process parameters
tures rather than the uniform coiled structure. used in fabricating the multi-layer structure were
o
Table 3. Optical microscope images of single layer scaffold under varied stage speed (FR=1 µL/min, D=3 mm, V=3 kV, T=25 C).
Scale bar 400 µm
Stage Vpeed (mm/s)
50 100 150 200 250 300
60%PCL
70%PCL
Table 4. Optical microscope images of single layer scaffold under varied stage speed and solution feed rate (C=60%, D=3 mm, V=3
kV, T=25 °C). 6FDOH bar 400 µm
Stage Vpeed (mm/s)
Feed Uate
100 150 200 250
1.5µL/min
2.0µL/min
International Journal of Bioprinting (2017)–Volume 3, Issue 1 79