
Page 303 - IJB-10-3
P. 303
International Journal of Bioprinting Design and optimization of 3DP bioscaffolds
First optimization step Second optimization step
(a) (f)
(b) (c) (g) (h)
(d) (e) (i) (j)
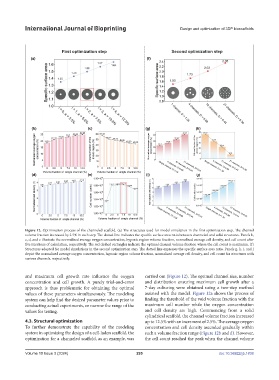
Figure 12. Optimization process of the channeled scaffold. (a) The structures used for model simulation in the first optimization step. The channel
volume fraction increased by 2.5% in each step. The dotted line indicates the specific surface area ratio between channeled and solid structures. Panels b,
c, d, and e illustrate the normalized average oxygen concentration, hypoxic region volume fraction, normalized average cell density, and cell count after
five iterations of calculation, respectively. The red dashed rectangles indicate the optimal channel volume fraction where the cell count is maximum. (f)
Structures adopted for model simulations in the second optimization step. The dotted line expresses the specific surface area ratio. Panels g, h, i, and j
depict the normalized average oxygen concentration, hypoxic region volume fraction, normalized average cell density, and cell count for structures with
various channels, respectively.
and maximum cell growth rate influence the oxygen carried out (Figure 12). The optimal channel size, number
concentration and cell growth. A purely trial-and-error and distribution ensuring maximum cell growth after a
approach is thus problematic for obtaining the optimal 7-day culturing were obtained using a two-step method
values of these parameters simultaneously. The modeling assisted with the model. Figure 12a shows the process of
system can help find the desired parameter values prior to finding the threshold of the void volume fraction with the
conducting actual experiments, or narrow the range of the maximum cell number while the oxygen concentration
values for testing. and cell density are high. Commencing from a solid
cylindrical scaffold, the channel volume fraction increased
4.3. Structural optimization up to 12.5% with an increment of 2.5%. The average oxygen
To further demonstrate the capability of the modeling concentration and cell density ascended gradually within
system in optimizing the design of a cell-laden scaffold, the such a volume fraction range (Figure 12b and d). However,
optimization for a channeled scaffold, as an example, was the cell count reached the peak when the channel volume
Volume 10 Issue 3 (2024) 295 doi: 10.36922/ijb.1838