
Page 298 - IJB-10-3
P. 298
International Journal of Bioprinting Design and optimization of 3DP bioscaffolds
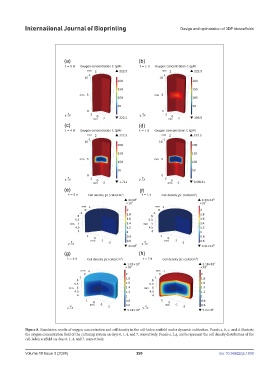
Figure 8. Simulation results of oxygen concentration and cell density in the cell-laden scaffold under dynamic cultivation. Panels a, b, c, and d illustrate
the oxygen concentration field of the culturing system on days 0, 1, 4, and 7, respectively. Panels e, f, g, and h represent the cell density distribution of the
cell-laden scaffold on days 0, 1, 4, and 7, respectively.
Volume 10 Issue 3 (2024) 290 doi: 10.36922/ijb.1838