
Page 297 - IJB-10-3
P. 297
International Journal of Bioprinting Design and optimization of 3DP bioscaffolds
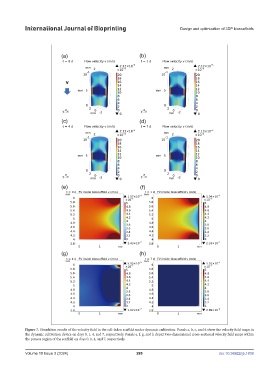
Figure 7. Simulation results of the velocity field in the cell-laden scaffold under dynamic cultivation. Panels a, b, c, and d show the velocity field maps in
the dynamic cultivation device on days 0, 1, 4, and 7, respectively. Panels e, f, g, and h depict two-dimensional cross-sectional velocity field maps within
the porous region of the scaffold on days 0, 1, 4, and 7, respectively.
Volume 10 Issue 3 (2024) 289 doi: 10.36922/ijb.1838