
Page 296 - IJB-10-3
P. 296
International Journal of Bioprinting Design and optimization of 3DP bioscaffolds
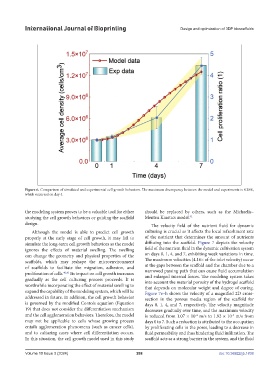
Figure 6. Comparison of simulated and experimental cell growth behaviors. The maximum discrepancy between the model and experiments is 4.38%,
which occurred on day 4.
the modeling system proves to be a valuable tool for either should be replaced by others, such as the Michaelis–
studying the cell growth behaviors or guiding the scaffold Menten Kinetics model. 42
design. The velocity field of the nutrient fluid for dynamic
Although the model is able to predict cell growth culturing is crucial as it affects the local refreshment rate
properly at the early stage of cell growth, it may fail to of the nutrient that determines the amount of nutrients
simulate the long-term cell growth behaviors as the model diffusing into the scaffold. Figure 7 depicts the velocity
ignores the effects of material swelling. The swelling field of the nutrient fluid in the dynamic cultivation system
can change the geometry and physical properties of the on days 0, 1, 4, and 7, exhibiting weak variations in time.
scaffolds, which may reshape the microenvironment The maximum velocities (4.16× of the inlet velocity) occur
of scaffolds to facilitate the migration, adhesion, and at the gaps between the scaffold and the chamber due to a
proliferation of cells. 40,41 Its impact on cell growth increases narrowed passing path that can cause fluid accumulation
and enlarged internal forces. The modeling system takes
gradually as the cell culturing process proceeds. It is into account the material porosity of the hydrogel scaffold
worthwhile incorporating the effect of material swelling to that depends on molecular weight and degree of curing.
expand the capability of the modeling system, which will be Figure 7e–h shows the velocity of a magnified 2D cross-
addressed in future. In addition, the cell growth behavior section in the porous media region of the scaffold for
is governed by the modified Contois equation (Equation days 0, 1, 4, and 7, respectively. The velocity magnitude
19) that does not consider the differentiation mechanism decreases gradually over time, and the maximum velocity
and the cell agglomeration behaviors. Therefore, the model is reduced from 1.07 × 10 m/s to 1.92 × 10 m/s from
-4
-5
may not be applicable to cells whose growing process days 0 to 7. Such a reduction is attributed to the occupation
entails agglomeration phenomena (such as cancer cells), by proliferating cells in the pores, leading to a decrease in
and to culturing cases where cell differentiation occurs. fluid permeability and thus hindering fluid infiltration. The
In this situation, the cell growth model used in this study scaffold acts as a strong barrier in the system, and the fluid
Volume 10 Issue 3 (2024) 288 doi: 10.36922/ijb.1838