
Page 559 - IJB-10-3
P. 559
International Journal of Bioprinting Engineered 3D-printed PVA vascular grafts
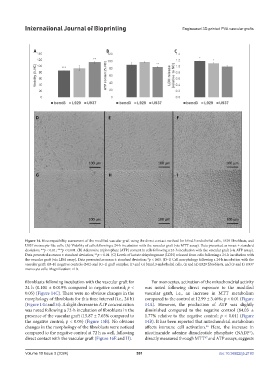
Figure 14. Biocompatibility assessment of the modified vascular graft using the direct contact method for bEnd.3 endothelial cells, L929 fibroblasts, and
U937 monocyte-like cells. (A) Viability of cells following a 24-h incubation with the vascular graft (via MTT assay). Data presented as mean ± standard
deviation; **p < 0.01; ***p < 0.001. (B) Adenosine triphosphate (ATP) content in cells following a 24-h incubation with the vascular graft (via ATP assay).
Data presented as mean ± standard deviation; **p < 0.01. (C) Levels of lactate dehydrogenase (LDH) released from cells following a 24-h incubation with
the vascular graft (via LDH assay). Data presented as mean ± standard deviation; *p < 0.05. (D–I) Cell morphology following a 24-h incubation with the
vascular graft: (D–F) negative controls (NC) and (G–I) graft samples; (D and G) bEnd.3 endothelial cells, (E and H) L929 fibroblasts, and (F and I) U937
monocyte cells. Magnification: ×10.
fibroblasts following incubation with the vascular graft for For monocytes, activation of the mitochondrial activity
24 h (0.101 ± 0.019% compared to negative control; p < was noted following direct exposure to the modified
0.05) (Figure 14C). There were no obvious changes in the vascular graft, i.e., an increase in MTT metabolism
morphology of fibroblasts for this time interval (i.e., 24 h) compared to the control at 12.99 ± 3.46%; p < 0.01 (Figure
(Figure 14E and H). A slight decrease in ATP concentration 14A). However, the production of ATP was slightly
was noted following a 72-h incubation of fibroblasts in the diminished compared to the negative control (84.03 ±
presence of the vascular graft (15.87 ± 7.65% compared to 1.77% relative to the negative control; p < 0.01) (Figure
the negative control; p < 0.05) (Figure 15B). No obvious 14B). It has been reported that mitochondrial metabolism
66
changes in the morphology of the fibroblasts were noticed affects immune cell activation. Here, the increase in
+
compared to the negative control at 72 h as well, following nicotinamide adenine dinucleotide phosphate (NADP ),
direct contact with the vascular graft (Figure 16E and H). directly measured through MTT and ATP assays, suggests
67
Volume 10 Issue 3 (2024) 551 doi: 10.36922/ijb.2193