
Page 571 - IJB-10-3
P. 571
International Journal of Bioprinting Bioprint micro breast cancer
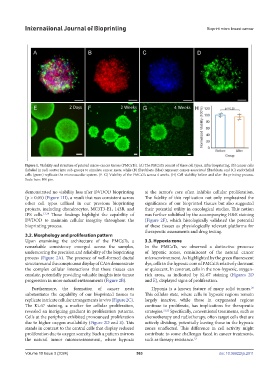
Figure 1. Viability and structure of printed micro-cancer tissues (PMCaTs). (A) The PMCaTs consist of three cell types. After bioprinting, (B) cancer cells
(labeled in red) scatter into sub-groups to simulate cancer nests, while (B) fibroblasts (blue) represent cancer-associated fibroblasts, and (C) endothelial
cells (green) replicate the microvascular system. (E–G) Viability of the PMCaTs across 4 weeks. (H) Cell viability before and after the printing process.
Scale bars: 100 μm.
demonstrated no viability loss after DVDOD bioprinting at the tumor’s core often inhibits cellular proliferation.
(p > 0.05) (Figure 1H), a result that was consistent across The fidelity of this replication not only emphasized the
other cell types utilized in our previous bioprinting significance of our bioprinted tissues but also suggested
projects, including chondrocytes, MC3T3-E1, 143B, and their potential utility in oncological studies. This notion
IPS cells. 13,14 These findings highlight the capability of was further solidified by the accompanying H&E staining
DVDOD to maintain cellular integrity throughout the (Figure 2F), which histologically validated the potential
bioprinting process. of these tissues as physiologically relevant platforms for
therapeutic assessments and drug testing.
3.2. Morphology and proliferation pattern
Upon examining the architecture of the PMCaTs, a 3.3. Hypoxia zone
remarkable consistency emerged across the samples, In the PMCaTs, we observed a distinctive presence
underscoring the precision and reliability of the bioprinting of hypoxic zones, reminiscent of the natural cancer
process (Figure 2A). The presence of well-formed ductal microenvironment. As highlighted by the green fluorescent
structures and the conspicuous display of CAFs demonstrate dye, cells in the hypoxic core of PMCaTs relatively dormant
the complex cellular interactions that these tissues can or quiescent. In contrast, cells in the non-hypoxic, oxygen-
emulate, potentially providing valuable insights into tumor rich areas, as indicated by Ki-67 staining (Figures 2D
progression in more natural environments (Figure 2B). and E), displayed signs of proliferation.
Furthermore, the formation of cancer nests Hypoxia is a known feature of many solid tumors.
20
substantiates the capability of our bioprinted tissues to This cellular state, where cells in hypoxic regions remain
replicate intricate cellular arrangements in vivo (Figure 2C). largely inactive, while those in oxygenated regions
The Ki-67 staining, a marker for cellular proliferation, continue to proliferate, has implications for therapeutic
revealed an intriguing gradient in proliferation patterns. strategies. 21,22 Specifically, conventional treatments, such as
Cells at the periphery exhibited pronounced proliferation chemotherapy and radiotherapy, often target cells that are
due to higher oxygen availability (Figure 2D and E). This actively dividing, potentially leaving those in the hypoxic
stands in contrast to the central cells that display reduced zones unaffected. This difference in cell activity might
proliferation due to oxygen scarcity. Such a pattern mirrors contribute to some challenges faced in cancer treatments,
the natural tumor microenvironment, where hypoxia such as therapy resistance. 23
Volume 10 Issue 3 (2024) 563 doi: 10.36922/ijb.2911