
Page 572 - IJB-10-3
P. 572
International Journal of Bioprinting Bioprint micro breast cancer
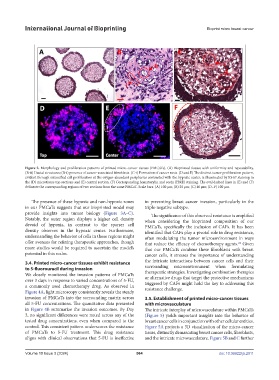
Figure 2. Morphology and proliferation patterns of printed micro-cancer tissues (PMCaTs). (A) Bioprinted tissues with uniformity and repeatability.
(B-ii) Ductal structures; (B-i) presence of cancer-associated fibroblasts. (C-i) Formation of cancer nests. (D and E) The distinct tumor proliferation pattern,
evident through intensified cell proliferation at the oxygen-abundant peripheries contrasted with the hypoxic center, is illuminated by Ki-67 staining in
the (D) microtissue top sections and (E) central section. (F) Corresponding hematoxylin and eosin (H&E) staining. The oval dashed lines in (E) and (F)
delineate the corresponding regions of two sections from the same PMCaT. Scale bars: (A) 100 μm; (B) 20 μm; (C) 40 μm; (D–F) 100 μm.
The presence of these hypoxic and non-hypoxic zones in preventing breast cancer invasion, particularly in the
in our PMCaTs suggests that our bioprinted model may triple-negative subtype.
provide insights into tumor biology (Figure 3A–C). The significance of this observed resistance is amplified
Notably, the outer region displays a higher cell density when considering the bioprinted composition of our
devoid of hypoxia, in contrast to the sparser cell PMCaTs, specifically the inclusion of CAFs. It has been
density observes in the hypoxic center. Furthermore, identified that CAFs play a pivotal role in drug resistance,
understanding the behavior of cells in these regions might often modulating the tumor microenvironment in ways
offer avenues for refining therapeutic approaches, though that reduce the efficacy of chemotherapy agents. Given
24
more studies would be required to ascertain the model’s that our PMCaTs combine these fibroblasts with breast
potential in this realm. cancer cells, it stresses the importance of understanding
3.4. Printed micro-cancer tissues exhibit resistance the intricate interactions between cancer cells and their
to 5-fluorouracil during invasion surrounding microenvironment when formulating
therapeutic strategies. Investigating combination therapies
We closely monitored the invasion patterns of PMCaTs
over 3 days in response to varied concentrations of 5-FU, or alternative drugs that target the protective mechanisms
a commonly used chemotherapy drug. As observed in triggered by CAFs might hold the key to addressing this
Figure 4A, light microscopy consistently reveals the steady resistance challenge.
invasion of PMCaTs into the surrounding matrix across 3.5. Establishment of printed micro-cancer tissues
all 5-FU concentrations. The quantitative data presented with microvasculature
in Figure 4B summarize the invasion outcomes. By Day The intricate interplay of microvasculature within PMCaTs
3, no significant differences were noted across any of the (Figure 5) yields important insights into the behavior of
tested drug concentrations, even when compared to the breast cancer cells in conjunction with other cellular entities.
control. This consistent pattern underscores the resistance Figure 5A projects a 3D visualization of the micro-cancer
of PMCaTs to 5-FU treatment. This drug resistance tissue, distinctly demarcating breast cancer cells, fibroblasts,
aligns with clinical observations that 5-FU is ineffective and the intricate microvasculature. Figure 5B and C further
Volume 10 Issue 3 (2024) 564 doi: 10.36922/ijb.2911