
Page 573 - IJB-10-3
P. 573
International Journal of Bioprinting Bioprint micro breast cancer
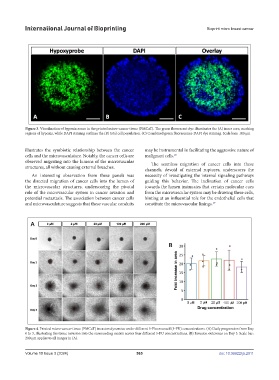
Figure 3. Visualization of hypoxia zones in the printed micro-cancer tissue (PMCaT). The green fluorescent dye illuminates the (A) inner core, marking
regions of hypoxia, while DAPI staining outlines the (B) total cell population. (C) Combined green fluorescence-DAPI dye staining. Scale bars: 100 μm
illustrates the symbiotic relationship between the cancer may be instrumental in facilitating the aggressive nature of
cells and the microvasculature. Notably, the cancer cells are malignant cells. 25
observed migrating into the lumens of the microvascular The seamless migration of cancer cells into these
structures, all without causing external breaches.
channels, devoid of external ruptures, underscores the
An interesting observation from these panels was necessity of investigating the internal signaling pathways
the directed migration of cancer cells into the lumen of guiding this behavior. The inclination of cancer cells
the microvascular structures, underscoring the pivotal towards the lumen insinuates that certain molecular cues
role of the microvascular system in cancer invasion and from the microvascular system may be drawing these cells,
potential metastasis. The association between cancer cells hinting at an influential role for the endothelial cells that
and microvasculature suggests that these vascular conduits constitute the microvascular linings. 19
Figure 4. Printed micro-cancer tissue (PMCaT) invasion dynamics under different 5-Fluorouracil (5-FU) concentrations. (A) Daily progression from Day
0 to 3, illustrating the tissue invasion into the surrounding matrix across four different 5-FU concentrations. (B) Invasion outcomes on Day 3. Scale bar:
200 μm applies to all images in (A).
Volume 10 Issue 3 (2024) 565 doi: 10.36922/ijb.2911