
Page 100 - IJB-4-1
P. 100
Mehri Behbehani, et al.
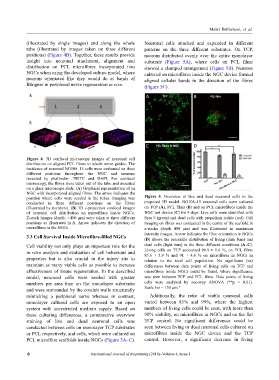
(illustrated by single images) and along the whole Neuronal cells attached and expanded in different
tube (illustrated by images taken on three different patterns on the three different substrates. On TCP,
positions) (Figure 4B). Together, these results provide neurons distributed evenly over the entire monolayer
insight into neuronal attachment, alignment and substrate (Figure 5A), where cells on PCL films
distribution on PCL microfibres incorporated into showed a clumped arrangement (Figure 5B). Neurons
NGCs when using the developed culture model, where cultured on microfibres inside the NGC device formed
neurons orientated like they would do as bands of aligned cellular bands in the direction of the fibres
Büngner in peripheral nerve regeneration in vivo. (Figure 5C).
Figure 4. 3D confocal microscopy images of neuronal cell
distribution on aligned PCL fibres in whole nerve guides. The
incidence of neuronal NG108–15 cells were evaluated on three
different positions throughout the NGC and neurons
revealed by phalloidin- TRITC and DAPI. For confocal
microscopy, the fibres were taken out of the tube and mounted
on a glass microscope slide. (A) Graphical representation of an
NGC with incorporated aligned fibres. The arrow indicates the
position where cells were seeded in the tubes. Imaging was Figure 5. Overview of live and dead neuronal cells in the
conducted in three different positions on the fibres proposed 3D model. NG108–15 neuronal cells were cultured
(illustrated by numbers). (B) 3D z-projection confocal images on TCP (A), PCL films (B) and on PCL microfibres inside the
of neuronal cell distribution on microfibres inside NGCs. NGC test device (C) for 4 days. Live cells were identified with
Z-stack images (depth: ∼400 µm) were taken at three different Syto 9 (green) and dead cells with propidium iodide (red). Cell
positions as illustrated in A. Arrow indicates the direction of imaging on fibres was conducted in the centre of the scaffold in
microfibres in the NGCs z-stacks (depth 400 µm) and was illustrated as maximum
intensity images. Arrow indicates the fibre orientation in NGCs.
3.3 Cell Survival Inside Microfibre-filled NGCs (D) shows the percentile distribution of living (dark bars) and
Cell viability not only plays an important role for the dead cells (light bars) in the three different conditions (A–C).
in vitro analysis and evaluation of cell behaviour and Living cells on TCP accounted 98.9 ± 0.6 %, on PCL films
85.6 ± 3.9 % and 91 ± 4.6 % on microfibres in NGCs in
properties but is also crucial in the injury site to relation to the total cell population. No significant (ns)
maintain as many viable cells as possible to increase differences between data points of living cells on TCP and
effectiveness of tissue regeneration. In the described microfibres inside NGCs could be found, where significance
model, neuronal cells were seeded with greater was seen between TCP and PCL films. Data points of living
numbers per area than on flat monolayer substrates cells were analysed by one-way ANOVA (**p < 0.01).
and were surrounded by the conduit walls structurally Scale bar = 150 µm."
mimicking a peripheral nerve whereas in contrast, Additionally, the ratio of viable neuronal cells
monolayer cultured cells are exposed to an open varied between 85% and 99%, where the highest
system with unrestricted medium supply. Based on numbers of living cells could be seen, with more than
these culturing differences, a comparative overview 90% viability, on microfibres in NGCs and on the flat
staining of live and dead neuronal cells was TCP control. No significant differences could be
conducted between cells on monolayer TCP substrates seen between living or dead neuronal cells cultured on
or PCL respectively, and cells, which were cultured on microfibres inside the NGC device and the TCP
PCL microfibre scaffolds inside NGCs (Figure 5A–C). control. However, a significant decrease in living
6 International Journal of Bioprinting (2018)–Volume 4, Issue 1