Page 101 - IJB-4-2
P. 101

Han X, et al.

                 A                             B                             C


                 D                             E                             F


                 G                             H                             I


                  J                            K                             L


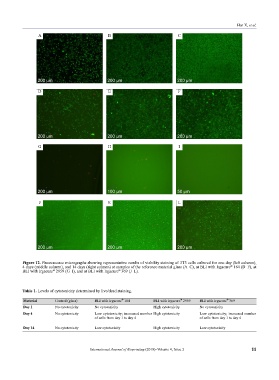
           Figure 12. Fluorescence micrographs showing representative results of viability staining of 3T3 cells cultured for one day (left column),
           4 days (middle column), and 14 days (right column) at samples of the reference material glass (A–C), at BLI with Irgacure  184 (D–F), at
                                                                                                   ®
           BLI with Irgacure  2959 (G–I), and at BLI with Irgacure  369 (J–L).
                                                    ®
                        ®
           Table 1. Levels of cytotoxicity determined by live/dead staining.

                                                                                                  ®
                                                                              ®
           Material      Control (glass)  BLI with Irgacure  184  BLI with Irgacure  2959  BLI with Irgacure  369
                                                     ®
           Day 1         No cytotoxicity  No cytotoxicity         High cytotoxicity   No cytotoxicity
           Day 4         No cytotoxicity  Low cytotoxicity; increased number High cytotoxicity  Low cytotoxicity; increased number
                                         of cells from day 1 to day 4                 of cells from day 1 to day 4
           Day 14        No cytotoxicity  Low cytotoxicity        High cytotoxicity   Low cytotoxicity


                                       International Journal of Bioprinting (2018)–Volume 4, Issue 2        11
   96   97   98   99   100   101   102   103   104   105   106