
Page 102 - IJB-4-2
P. 102
Optimized vascular network by stereolithography for tissue engineered skin
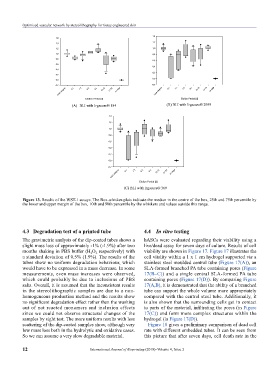
Figure 13. Results of the WST-1 assays. The Box-whisker-plots indicate the median in the centre of the box, 25th and 75th percentile by
the lower and upper margin of the box, 10th and 90th percentile by the whiskers and values outside this range.
4.3 Degradation test of a printed tube 4.4 In vitro testing
The gravimetric analysis of the dip-coated tubes shows a hASCs were evaluated regarding their viability using a
slight mass loss of approximately -1% (-1.9%) after two live/dead assay for seven days of culture. Results of cell
months shaking in PBS buffer (H O respectively) with viability are shown in Figure 17. Figure 17 illustrates the
2
2
a standard deviation of 0.5% (1.9%). The results of the cell vitality within a 1 x 1 cm hydrogel supported via a
tubes show no uniform degradation behaviour, which stainless steel moulded central tube (Figure 17(A)), an
would have to be expressed in a mass decrease. In some SLA-formed branched PA tube containing pores (Figure
measurements, even mass increases were observed, 17(B–C)) and a single central SLA-formed PA tube
which could probably be due to inclusions of PBS containing pores (Figure 17(D)). By comparing Figure
salts. Overall, it is assumed that the inconsistent results 17(A,B), it is demonstrated that the ability of a branched
in the stereolithographic samples are due to a non- tube can support the whole volume more appropriately
homogeneous production method and the results show compared with the central steel tube. Additionally, it
no significant degradation effect rather than the washing is also shown that the surrounding cells get in contact
out of not reacted monomers and inclusion effects to parts of the material, infiltrating the pores (in Figure
since we could not observe structural changes of the 17(C)) and form more complex structures within the
samples by sight test. The more uniform results with less hydrogel (in Figure 17(D)).
scattering of the dip-coated samples show, although very Figure 18 gives a preliminary comparison of dead cell
low mass loss both in the hydrolytic and oxidative cases. rate with different embedded tubes. It can be seen from
So we can assume a very slow degradable material. this picture that after seven days, cell death rate in the
12 International Journal of Bioprinting (2018)–Volume 4, Issue 2