
Page 190 - IJB-10-4
P. 190
International Journal of Bioprinting Effects of structure on the interbody cage
growth of the pore diameter and the number of crossing of the beams increased, the compressive modulus of the
layers of the beams. The compressive strength of human cages all increased. This is because a larger number of
cancellous bone ranges from 2 to 12 MPa. In the initial crossing layers of beams also implies that there are more
15
state before in vitro degradation, the compressive strengths bases of beams stacked in the same direction, resulting in
of the six structures were 5.48 MPa, 4.74 MPa, 3.58 MPa, an increase in the vertical stiffness of the total structure.
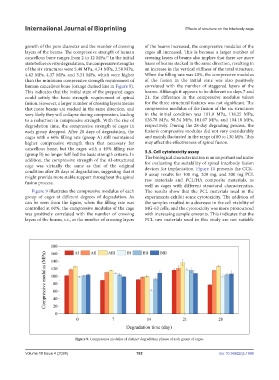
4.42 MPa, 4.37 MPa, and 3.31 MPa, which were higher When the filling rate was 40%, the compressive modulus
than the minimum compressive strength requirement of of the fusion in the initial state was also positively
human cancellous bone (orange dashed line in Figure 8). correlated with the number of staggered layers of the
This indicates that the initial state of the prepared cages beams. Although it appears to be different on days 7 and
could satisfy the basic strength requirement of spinal 21, the difference in the compressive modulus values
fusion. However, a larger number of crossing layers means for the three structural features was not significant. The
that more beams are stacked in the same direction, and compressive modulus of the fusion of the six structures
very likely they will collapse during compression, leading in the initial condition was 101.9 MPa, 118.25 MPa,
to a reduction in compressive strength. With the rise of 126.78 MPa, 98.54 MPa, 101.07 MPa, and 104.18 MPa,
degradation time, the compressive strength of cages in respectively. During the 28-day degrading process, the
each group dropped. After 28 days of degradation, the fusion’s compressive modulus did not vary considerably
cages with a 60% filling rate (group A) still maintained and mainly fluctuated in the range of 80 to 130 MPa. This
higher compressive strength than that necessary for may affect the effectiveness of spinal fusion.
cancellous bone, but the cages with a 40% filling rate
(group B) no longer fulfilled the basic strength criteria. In 3.5. Cell cytotoxicity assay
addition, the compressive strength of the AI-structured The biological characterization is an important indicator
cage was virtually the same as that of the original for evaluating the suitability of spinal interbody fusion
devices for implantation. Figure 10 presents the CCK-
condition after 28 days of degradation, suggesting that it 8 assay results for 100 mg, 200 mg, and 300 mg PCL
might provide more stable support throughout the spinal raw materials and PCL/HA composite materials, as
fusion process.
well as cages with different structural characteristics.
Figure 9 illustrates the compressive modulus of each The results show that the PCL materials used in the
group of cages at different degrees of degradation. As experiments exhibit some cytotoxicity. The addition of
can be seen from the figure, when the filling rate was the samples resulted in a decrease in the cell viability of
controlled at 60%, the compressive modulus of the cage MG-63 cells, and the cytotoxicity was more pronounced
was positively correlated with the number of crossing with increasing sample amounts. This indicates that the
layers of the beams, i.e., as the number of crossing layers PCL raw materials used in this study are not suitable
Figure 9. Compressive modulus of distinct degradation phases of each group of cages.
Volume 10 Issue 4 (2024) 182 doi: 10.36922/ijb.1996