
Page 387 - IJB-10-4
P. 387
International Journal of Bioprinting 3D cartilage induction and monitoring
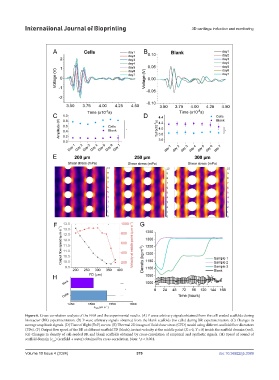
Figure 6. Cross-correlation analysis of the FEM and the experimental results. (A) P-wave arbitrary signals obtained from the cell-seeded scaffolds during
bioreactor (BR) experimentation. (B) P-wave arbitrary signals obtained from the blank scaffolds (no cells) during BR experimentation. (C) Changes in
average amplitude signals. (D) Time of flight (ToF) curves. (E) Thermal 2D images of fluid shear stress (CFD) model using different scaffold fiber diameters
(FDs). (F) Output flow speed of the BR at different scaffold FD (black); instant velocity at the middle point (X = 0, Y = 0) inside the scaffold domain (red).
(G) Changes in density of cell-seeded BR and blank scaffolds obtained by cross-correlation of empirical and synthetic signals. (H) Speed of sound of
scaffold domain (c ) (scaffold + water) obtained by cross-correlation. Note: *p < 0.001.
SD
Volume 10 Issue 4 (2024) 379 doi: 10.36922/ijb.3389