
Page 384 - IJB-10-4
P. 384
International Journal of Bioprinting 3D cartilage induction and monitoring
ultrasound wave obtained by the proposed model as a Different flow regimes and flow rates were tested (Figure
floating potential of the transducer (receiver) (Video S3, 4A) to evaluate cell proliferation and viability.
Supporting Information). IPFP-MSCs were isolated and cultured from OA
patients until passages 3–5. IPFPF-MSCs were identified
3.3. Viability and chondrogenic characterization using the standards recommended by the ISCT (Figure
45
Alamar Blue reagent was used to detect metabolic activity S4, Supporting Information). Following this, 10 cells·mL
−1
6
in the bTPUe-PBA scaffolds after seeding IPFP-MSCs. were seeded over scaffolds and incubated for 4 h at 37ºC
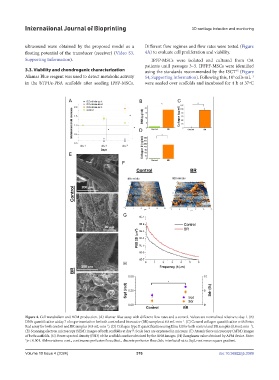
Figure 4. Cell metabolism and ECM production. (A) Alamar Blue assay with different flow rates and a control. Values are normalized relative to day 1. (B)
DNA quantification at day 7 of experimentation for both control and bioreactor (BR) samples at 0.8 mL·min . (C) General collagen quantification with Sirius
−1
Red assay for both control and BR samples (0.8 mL·min ). (D) Collagen type II quantification using Elisa kit for both control and BR samples (0.8 mL·min ).
−1
−1
(E) Scanning electron microscopy (SEM) images of both scaffolds at day 7. Scale bars are expressed in microns. (F) Atomic force microscopy (AFM) images
of both scaffolds. (G) Power spectral density (PSD) of the scaffolds surface obtained by the AFM images. (H) Roughness value obtained by AFM device. Note:
*p < 0.001. Abbreviations: cont., continuous perfusion flow; disct., discrete perfusion flow; Sdr, interfacial ratio; Sqd, root mean square gradient.
Volume 10 Issue 4 (2024) 376 doi: 10.36922/ijb.3389