
Page 381 - IJB-10-4
P. 381
International Journal of Bioprinting 3D cartilage induction and monitoring
programmed to make a pulsed signal in the form of a Figure 2A and B displays the complete BR assembly
single sinusoidal wave to capture each signal between 30 and the electronic circuit regulating the peristaltic pump.
and 50 µs (established from the first time of flight [TOF] of All components in Figure 2A were sterilized with Biozidal
scaffold signals measured at approximately 35 µs). ZF (WAK-Chemie Medical GmbH, Germany) and 70%
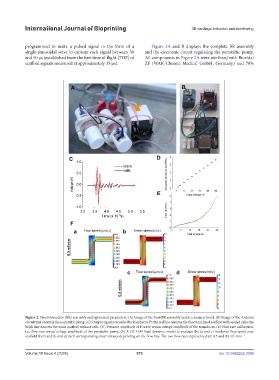
Figure 2. Final bioreactor (BR) assembly and optimized parameters. (A) Image of the final BR assembly inside a laminar hood. (B) Image of the Arduino
circuit that controls the peristaltic pump. (C) Output signals recorded by Raspberry Pi; the red line denotes the functionalized scaffold with seeded cells; the
black line denotes the same scaffold without cells. (D) Pressure amplitude of P-wave versus voltage amplitude of the transducer. (E) Flow rate calibration,
i.e., flow rate versus voltage amplitude of the peristaltic pump. (F) A 2D FEM fluid dynamic model to evaluate the (a and c) incidence flow speed over
scaffold fibers and (b and d) their corresponding shear stresses depending on the flow rate. The two flow rates represented are 0.5 and 0.8 mL·min .
−1
Volume 10 Issue 4 (2024) 373 doi: 10.36922/ijb.3389