
Page 445 - IJB-10-4
P. 445
International Journal of Bioprinting Improving ductility of 3D-printed Zn–Mg
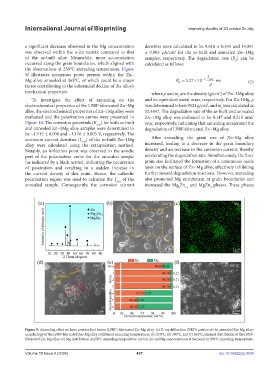
a significant decrease observed in the Mg concentration densities were calculated to be 9.618 ± 0.345 and 14.091
was observed within the α-Zn matrix compared to that ± 0.903 μA/cm for the as-built and annealed Zn–1Mg
2
of the as-built alloy. Meanwhile, more accumulation samples, respectively. The degradation rate (R ) can be
d
occurred along the grain boundaries, which aligned with calculated as follows:
the observations at 250°C annealing temperature. Figure
9f illustrates numerous pores present within the Zn– I
Mg alloy annealed at 365°C, of which could be a major R = 32710. × −3 corr me (5)
d
factor contributing to the substantial decline of the alloy’s ρ
mechanical properties. where ρ and m are the density (g/cm ) of Zn–1Mg alloy
3
e
To investigate the effect of annealing on the and its equivalent metal mass, respectively. For Zn-1Mg, ρ
electrochemical properties of the LPBF-fabricated Zn–Mg was determined to be 6.9521 g/cm , and m was calculated as
3
e
alloy, the electrochemical properties of Zn–1Mg alloy were 32.4847. The degradation rate of the as-built and annealed
evaluated and the polarization curves were presented in Zn–1Mg alloy was evaluated to be 0.147 and 0.215 mm/
Figure 10. The corrosion potentials (E ) for both as-built year, respectively, indicating that annealing accelerated the
corr
and annealed Zn–1Mg alloy samples were determined to degradation of LPBF-fabricated Zn–Mg alloy.
be −1.115 ± 0.008 and −1.116 ± 0.003 V, respectively. The
corrosion current densities (I ) of the as-built Zn–1Mg After annealing, the grain size of Zn–Mg alloy
corr
alloy were calculated using the extrapolation method. increased, leading to a decrease in the grain boundary
Notably, an inflection point was observed in the anodic density and an increase in the corrosion current, thereby
part of the polarization curve for the annealed sample accelerating the degradation rate. Simultaneously, the finer
(as indicated by a black arrow), indicating the occurrence grain size facilitated the formation of a continuous oxide
of passivation and resulting in a sudden increase in layer on the surface of Zn–Mg alloy, effectively inhibiting
the current density at this point. Hence, the cathodic further inward degradation reactions. However, annealing
polarization region was used to calculate the I of the also promoted Mg enrichment at grain boundaries and
corr
annealed sample. Consequently, the corrosion current increased the Mg Zn and MgZn phases. These phases
2 11 2
Figure 9. Annealing effect on laser powder bed fusion (LPBF)-fabricated Zn–Mg alloy: (a) X-ray diffraction (XRD) pattern of the annealed Zn–Mg alloy;
morphology of the LPBF-fabricated Zn–Mg alloy at different annealing temperatures: (b) 250°C, (d) 300°C, and (f) 365°C; element distribution of the LPBF-
fabricated Zn–Mg alloy: (c) Mg distribution at 250°C annealing temperature, and (e) Zn and Mg concentrations at the point in 300°C annealing temperature.
Volume 10 Issue 4 (2024) 437 doi: 10.36922/ijb.3034