
Page 446 - IJB-10-4
P. 446
International Journal of Bioprinting Improving ductility of 3D-printed Zn–Mg
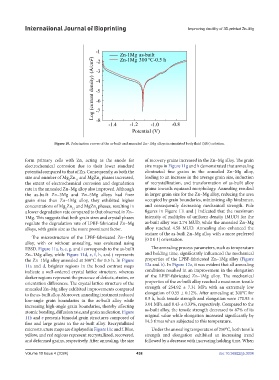
Figure 10. Polarization curves of the as-built and annealed Zn–1Mg alloys in simulated body fluid (SBF) solution.
form primary cells with Zn, acting as the anode for of recovery grains increased in the Zn–Mg alloy. The grain
electrochemical corrosion due to their lower standard size maps in Figure 11g and h demonstrated that annealing
potential compared to that of Zn. Consequently, as both the eliminated fine grains in the annealed Zn–Mg alloy,
size and number of Mg Zn and MgZn phases increased, leading to an increase in the average grain size, induction
2
2
11
the extent of electrochemical corrosion and degradation of recrystallization, and transformation of as-built alloy
rate in the annealed Zn–Mg alloy also improved. Although grains towards equiaxed morphology. Annealing resulted
the as-built Zn–3Mg and Zn–5Mg alloys had finer in larger grain size for the Zn–Mg alloy, reducing the area
grain sizes than Zn–1Mg alloy, they exhibited higher occupied by grain boundaries, minimizing slip hindrance,
concentrations of Mg Zn and MgZn phases, resulting in and consequently decreasing mechanical strength. Pole
2
2
11
a lower degradation rate compared to that observed in Zn– figures in Figure 11i and j indicated that the maximum
1Mg. This suggests that both grain sizes and crystal phases intensity of multiples of uniform density (MUD) for the
regulate the degradation rate of LPBF-fabricated Zn–Mg as-built alloy was 2.74 MUD, while the annealed Zn–Mg
alloys, with grain size as the more prominent factor. alloy reached 4.58 MUD. Annealing also enhanced the
texture of the as-built Zn–Mg alloy with a more preferred
The microstructure of the LPBF-fabricated Zn–1Mg {0 0 0 1} orientation.
alloy, with or without annealing, was evaluated using
EBSD. Figure 11a, b, c, g, and i corresponds to the as-built The annealing process parameters, such as temperature
Zn–1Mg alloy, while Figure 11d, e, f, h, and j represents and holding time, significantly influenced the mechanical
the Zn–1Mg alloy annealed at 300°C for 0.5 h. In Figure properties of the LPBF-fabricated Zn–1Mg alloy (Figure
11a and d, brighter regions in the bond contrast maps 12a and b). In Figure 12a, it was evident that all annealing
indicate a well-ordered crystal lattice structure, whereas conditions resulted in an improvement in the elongation
darker regions represent the presence of defects, strains, or of the LPBF-fabricated Zn–1Mg alloy. The mechanical
orientation differences. The crystal lattice structure of the properties of the as-built alloy reached a maximum tensile
annealed Zn–Mg alloy exhibited improvements compared strength of 254.92 ± 7.31 MPa with an extremely low
to the as-built alloy. Moreover, annealing treatment reduced elongation of 0.55 ± 0.12%. After annealing at 300°C for
low-angle grain boundaries in the as-built alloy while 0.5 h, both tensile strength and elongation were 170.93 ±
increasing high-angle grain boundaries, thereby affecting 3.01 MPa and 8.43 ± 0.33%, respectively. Compared to the
atomic bonding, diffusion rate, and grain nucleation. Figure as-built alloy, the tensile strength decreased to 67% of its
11b and e presents bimodal grain structures composed of original value while elongation increased significantly by
fine and large grains in the as-built alloy. Recrystallized 14.3 times when subjected to this temperature.
microstructure maps are displayed in Figure 11c and f. Blue, Under the annealing temperature of 250°C, both tensile
yellow, and red regions represent recrystallized, recovered, strength and elongation exhibited an increasing trend
and deformed grains, respectively. After annealing, the size followed by a decrease with increasing holding time. When
Volume 10 Issue 4 (2024) 438 doi: 10.36922/ijb.3034