
Page 473 - IJB-10-4
P. 473
International Journal of Bioprinting 3D-bioprinted peripheral nerve scaffold
and re-stained with hematoxylin. Gastrocnemius muscles (Figure S1 in Supplementary File). SHEDs were reported
were obtained 8 weeks post-surgery. Wet muscle weight to possess multipotent differentiation capabilities.
was recorded prior to fixation for each group. The middle Upon differentiation, SHEDs would transform from
muscle was fixed in 10% formalin for hematoxylin and an intermediate spindle-like morphology to a bipolar
eosin (HE) and Masson stainings. morphology.
2.6. Statistical analysis The differentiation of SHEDs into scSHEDs was
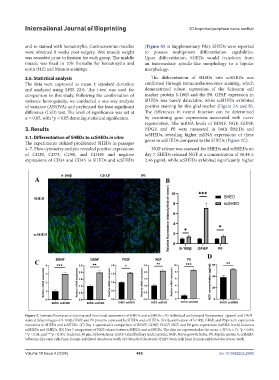
The data were expressed as mean ± standard deviation confirmed through immunofluorescence staining, which
and analyzed using SPSS 22.0. The t-test was used for demonstrated robust expression of the Schwann cell
comparison in this study. Following the confirmation of marker protein S-100β and the P0. GFAP expression in
variance homogeneity, we conducted a one-way analysis SHEDs was barely detectable, while scSHEDs exhibited
of variance (ANOVA) and performed the least significant positive staining for this glial marker (Figure 2A and B).
difference (LSD) test. The level of significance was set at The differences in neural function can be determined
α = 0.05, with *p < 0.05 denoting statistical significance. by examining gene expressions associated with nerve
regeneration. The mRNA levels of BDNF, NGF, GDNF,
3. Results PDGF, and P0 were measured in both SHEDs and
scSHEDs, revealing higher mRNA expressions of these
3.1. Differentiation of SHEDs to scSHEDs in vitro
The experiments utilized proliferated SHEDs in passages genes in scSHEDs compared to the SHEDs (Figure 2C).
4–7. Flow cytometry analysis revealed positive expressions NGF release was assessed for SHEDs and scSHEDs on
of CD29, CD73, CD90, and CD105 and negative day 7. SHEDs released NGF at a concentration of 38.44 ±
expressions of CD34 and CD45 in SHEDs and scSHEDs 2.46 pg/ml, while scSHEDs exhibited significantly higher
Figure 2. Immunofluorescence staining and functional assessment of SHEDs and scSHEDs. (A) Individual and merged fluorescence- (green) and DAPI-
stained (blue) images of S-100β, GFAP, and P0 proteins expressed by SHEDs and scSHEDs. (B) Quantification of S-100β, GFAP, and P0 protein expression
intensities in SHEDs and scSHEDs. (C) Day 4 quantitative comparison of BDNF, GDNF, PDGF, NGF, and P0 gene expressions (mRNA levels) between
scSHEDs and SHEDs. (D) Day 7 comparison of NGF release between SHEDs and scSHEDs. The data are represented as the mean ± SD (n = 3). *p < 0.05;
**p < 0.01; and ***p < 0.001. Scale bar: 50 μm. Abbreviations: GFAP: Glial fibrillary acidic protein; NGF: Nerve growth factor; P0: Myelin protein 0; scSHED:
Schwann-like stem cells from human-exfoliated deciduous teeth; SD: Standard deviation; SHED: Stem cells from human-exfoliated deciduous teeth.
Volume 10 Issue 4 (2024) 465 doi: 10.36922/ijb.2908