
Page 33 - IJB-5-2
P. 33
Takagi D, et al.
A B
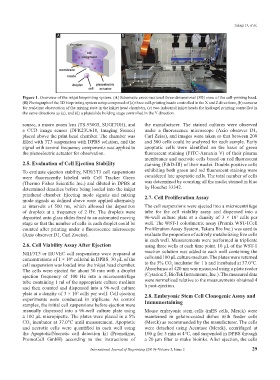
Figure 1. Overview of the inkjet bioprinting system. (A) Schematic cross-sectional three-dimensional (3D) view of the cell-printing head.
(B) Photograph of the 3D bioprinting system setup composed of (a) three cell-printing heads controlled in the X and Z directions, (b) cameras
for real-time observation of the mixing state in the inkjet head chambers, (c) two industrial inkjet heads for hydrogel printing controlled in
the same directions as (a), and (d) a plate/slide holding stage controlled in the Y direction.
source, a macro zoom lens (TS-93005, SUGITOH), and the manufacturer. The stained cultures were observed
a CCD image sensor (DFK23U618, Imaging Source) under a fluorescence microscope (Axio observer D1,
placed above the print head chamber. The chamber was Carl Zeiss), and images were taken so that between 200
filled with 3T3 suspension with DPBS solution, and the and 500 cells could be analyzed for each sample. Early
signal with several frequency components was applied to apoptotic cells were identified on the basis of green
the piezoelectric actuator for observation. fluorescent staining (FITC-Annexin V) of their plasma
membranes and necrotic cells based on red fluorescent
2.5. Evaluation of Cell Ejection Stability staining (EthD-III) of their nuclei. Double positive cells
To evaluate ejection stability, NIH/3T3 cell suspensions exhibiting both green and red fluorescent staining were
were fluorescently labeled with Cell Tracker Green considered late apoptotic cells. The total number of cells
(Thermo Fisher Scientific Inc.) and diluted in DPBS at was determined by counting all the nuclei stained in blue
determined densities before being loaded into the inkjet by Hoechst 33342.
printhead chamber. Ejecting mode signals and mixing 2.7. Cell Proliferation Assay
mode signals as defined above were applied alternately
at intervals of 500 ms, which allowed the deposition The cell suspensions were ejected into a microcentrifuge
of droplets at a frequency of 2 Hz. The droplets were tube for the cell viability assay and dispensed into a
deposited onto glass slides fixed to an automated moving 96-well culture plate at a density of 3 × 10 cells per
3
stage so that the number of cells in each droplet could be well. The WST-1 colorimetric assay (Premix WST-1Cell
counted after printing under a fluorescence microscope Proliferation Assay System, Takara Bio Inc.) was used to
(Axio observer D1, Carl Zweiss). evaluate the proportion of actively metabolizing live cells
in each well. Measurements were performed in triplicate
2.6. Cell Viability Assay After Ejection using three wells at each time point. 10 μL of the WST-1
NIH/3T3 or HUVEC cell suspensions were prepared at reaction solution was added to each well containing the
concentrations of 1 × 10 cells/ml in DPBS. 30 μL of the cells and 100 μL culture medium. The plates were returned
6
cell suspension was loaded into the inkjet head chamber. to the 5% CO incubator for 1 h and incubated at 37.0°C.
2
The cells were ejected for about 30 min with a droplet Absorbance at 420 nm was measured using a plate reader
ejection frequency of 100 Hz into a microcentrifuge (Cytation 5, BioTek Instruments, Inc.). The measured data
tube containing 1 ml of the appropriate culture medium were normalized relative to the measurements obtained 4
and then counted and dispensed into a 96-well culture h post-ejection.
plate at a density of 3 × 10 cells per well. Cell ejection 2.8. Embryonic Stem Cell Clonogenic Assay and
3
experiments were conducted in triplicate. As control Immunostaining
samples, the initial cell suspensions before ejection were
manually dispensed into a 96-well culture plate using Mouse embryonic stem cells (mES cells, Merck) were
a 100 μL micropipette. The plates were placed in a 5% maintained in gelatin-coated dishes with feeder cells
CO incubator at 37.0°C until measurement. Apoptotic (Merck) as recommended by the manufacturer. The cells
2
and necrotic cells were quantified in each well using were detached using Accutase (Merck), centrifuged at
the Apoptotic/Necrotic cell detection kit (Promokine, 100 g for 5 min at 4°C, and suspended in DPBS through
PromoCell GmbH) according to the instructions of a 20 mm filter to make bioinks. After ejection, the cells
International Journal of Bioprinting (2019)–Volume 5, Issue 2 29