
Page 37 - IJB-5-2
P. 37
Takagi D, et al.
A B
C D E
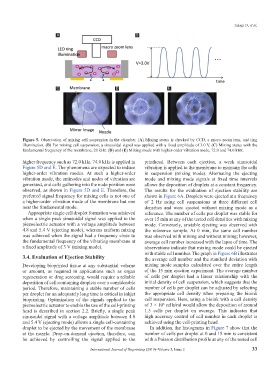
Figure 5. Observation of mixing cell suspension in the chamber. (A) Mixing status is checked by CCD, a micro zoom lens, and ring
illumination. (B) For mixing cell suspension, a sinusoidal signal was applied with a fixed amplitude of 3.0 V. (C) Mixing status with the
fundamental frequency of the membrane, 20 kHz. (D) and (E) Mixing mode with higher-order vibration mode, 72.0 and 74.0 kHz.
higher frequency such as 72.0 kHz. 74.0 kHz is applied in printhead. Between each ejection, a weak sinusoidal
Figure 5D and E. The phenomena are expected to induce vibration is applied to the membrane to maintain the cells
higher-order vibration modes. At such a higher-order in suspension (mixing mode). Alternating the ejecting
vibration mode, the antinodes and nodes of vibration are mode and mixing mode signals at fixed time intervals
generated, and cells gathering into the node position were allows the deposition of droplets at a constant frequency.
observed, as shown in Figure 5D and E. Therefore, the The results for the evaluation of ejection stability are
preferred signal frequency for mixing cells is not one of shown in Figure 6A. Droplets were ejected at a frequency
a higher-order vibration mode of the membrane but one of 2 Hz using cell suspensions at three different cell
near the fundamental mode. densities and were ejected without mixing mode as a
Appropriate single cell droplet formation was achieved reference. The number of cells per droplet was stable for
when a single peak sinusoidal signal was applied to the over 15 min at any of the tested cell densities with mixing
piezoelectric actuator with a voltage amplitude between mode. Conversely, unstable ejecting was observed with
4.8 and 5.4 V (ejecting mode), whereas uniform mixing the reference sample. At 0 min, the same cell number
was achieved when the signal had a frequency close to was observed with mixing and without mixing; however,
the fundamental frequency of the vibrating membrane at average cell number increased with the lapse of time. The
a fixed amplitude of 3 V (mixing mode). observations indicate that mixing mode could be ejected
with stable cell number. The graph in Figure 6B illustrates
3.4. Evaluation of Ejection Stability the average cell number and the standard deviation with
Developing bioprinted tissue at any substantial volume mixing mode samples calculated over the entire length
or amount, as required in applications such as organ of the 15 min ejection experiment. The average number
regeneration or drug screening, would require a reliable of cells per droplet had a linear relationship with the
deposition of cell-containing droplets over a considerable initial density of cell suspension, which suggests that the
period. Therefore, maintaining a stable number of cells number of cells per droplet can be adjusted by selecting
per droplet for an adequately long time is critical in inkjet the appropriate cell density when preparing the bioink
bioprinting. Optimization of the signals applied to the cell suspension. Here, using a bioink with a cell density
piezoelectric actuator to enable the use of the cell-printing of 3 × 10 cells/ml would allow the deposition of around
6
head is described in section 2.2. Briefly, a single peak 1.5 cells per droplet on average. This indicates that
sinusoidal signal with a voltage amplitude between 4.8 high accuracy control of cell number in each droplet is
and 5.4 V (ejecting mode) allows a single cell-containing achieved using the cell-printing head.
droplet to be ejected by the movement of the membrane In addition, the histograms in Figure 7 show that the
at the nozzle. Drop-on-demand ejection, therefore, can number of cells per droplet at 0 and 15 min is consistent
be achieved by controlling the signal applied to the with a Poisson distribution profile at any of the tested cell
International Journal of Bioprinting (2019)–Volume 5, Issue 2 33