
Page 36 - IJB-5-2
P. 36
A novel inkjet system for live cell bioprinting
with volumes as low as a few dozen microliters without pushes the liquid; pressure is generated at the interface
compromising droplet formation. between the membrane and liquid. Since the pressure is
easily released into the atmosphere through the nozzle
3.2. Evaluation of Inkjetting Condition rather than through the upper aperture of the chamber
To determine the optimal printing conditions, optical or pushes back the membrane, the meniscus protrudes
monitoring devices were assembled as follows. out of the nozzle (Figure 4E). Thereafter, the membrane
Observation of drop formation was carried out, as attempts to revert to the original position. However, if
illustrated in Figure 4A. By applying a signal as shown the liquid in the nozzle portion at the time receives an
in Figure 4B to the piezoelectric actuator of the cell- adequate velocity, the liquid droplet is considered to be
printing head, a droplet is ejected from the cell-printing formed, as shown in Figure 4F.
head. Frequency of the applied signal was fixed to the 3.3. Evaluation of Mixing Condition
fundamental frequency of the membrane.
Results of drop formation with voltage amplitudes Observation of cell suspension mixing was carried
between 4.4 and 5.8 V are shown in Figure 4C. One drop out as illustrated in Figure 5A, and the signal is shown
formation is achieved when the voltage V ranges from in Figure 5B with several frequencies applied to the
4.8 to 5.4 V. When the voltage is lower than 4.8 V, the piezoelectric actuator for the observation.
pressure required for drop formation cannot be achieved. The circle in each figure indicates the membrane.
Conversely, when the voltage is higher than 5.4 V, minute The nozzle is located in the center of the membrane,
droplets (mist and satellite) are formed. and ring-shaped mirror images of the illuminations are
A droplet forming process in the cell printhead will be seen in each figure. In Figure 5C, uniform mixing mode
described with reference to the schematic view as shown is observed by applying the signal at a frequency near
in Figure 4E and F. When the membrane is displaced from the fundamental frequency of the membrane (20 kHz).
the original state to the liquid chamber side and suddenly Conversely, the periodic pattern is observed by applying a
A B
C D
E F
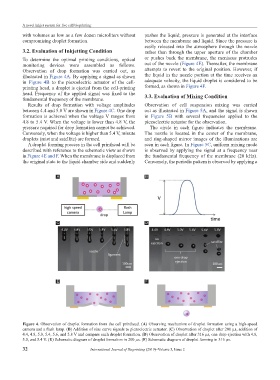
Figure 4. Observation of droplet formation from the cell printhead. (A) Observing mechanism of droplet formation using a high-speed
camera and a flash lamp. (B) Addition of sine curve signals to piezoelectric actuator. (C) Observation of droplet after 200 µs, addition of
4.4, 4.8, 5.0, 5.4, 5.6, and 5.8 V and compare each droplet formation. (D) Observation of droplet after 316 µs, one drop ejection with 4.8,
5.0, and 5.4 V. (E) Schematic diagram of droplet formation in 200 µs. (F) Schematic diagram of droplet forming in 316 µs.
32 International Journal of Bioprinting (2019)–Volume 5, Issue 2